


by
, , , , , , , , , , , , , and


J. Imaging 2023, 9(8), 159; https://doi.org/10.3390/jimaging9080159 - 08 Aug 2023
Abstract
Accurate detection of respiratory system damage including COVID-19 is considered one of the crucial applications of deep learning (DL) models using CT images. However, the main shortcoming of the published works has been unreliable reported accuracy and the lack of repeatability with new
[...] Read more.
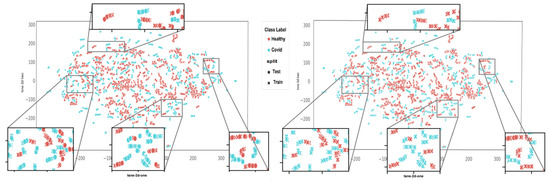
Accurate detection of respiratory system damage including COVID-19 is considered one of the crucial applications of deep learning (DL) models using CT images. However, the main shortcoming of the published works has been unreliable reported accuracy and the lack of repeatability with new datasets, mainly due to slice-wise splits of the data, creating dependency between training and test sets due to shared data across the sets. We introduce a new dataset of CT images (ISFCT Dataset) with labels indicating the subject-wise split to train and test our DL algorithms in an unbiased manner. We also use this dataset to validate the real performance of the published works in a subject-wise data split. Another key feature provides more specific labels (eight characteristic lung features) rather than being limited to COVID-19 and healthy labels. We show that the reported high accuracy of the existing models on current slice-wise splits is not repeatable for subject-wise splits, and distribution differences between data splits are demonstrated using t-distribution stochastic neighbor embedding. We indicate that, by examining subject-wise data splitting, less complicated models show competitive results compared to the exiting complicated models, demonstrating that complex models do not necessarily generate accurate and repeatable results.
Full article
(This article belongs to the Section Medical Imaging)
►
Show Figures
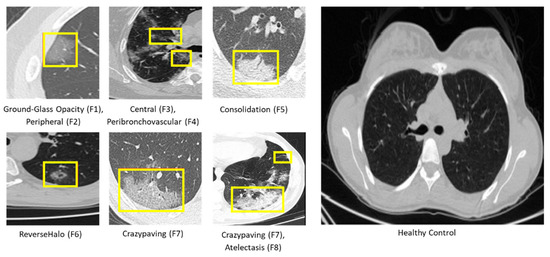
Figure 1


