Next Article in Journal
Kinetic Ultrasound-Assisted Extraction as a Sustainable Approach for the Recovery of Phenolics Accumulated through UVA Treatment in Strawberry By-Products
Previous Article in Journal
Dynamic Formation of Green Tea Cream and the Identification of Key Components Using the “Knock-Out/Knock-In” Method
Previous Article in Special Issue
Screening, Identification and Physiological Characteristics of Lactobacillus rhamnosus M3 (1) against Intestinal Inflammation
 
 
Order Article Reprints
Article

Genome Analysis of Bifidobacterium Bifidum E3, Structural Characteristics, and Antioxidant Properties of Exopolysaccharides

1
Key Laboratory of Dairy Science, Ministry of Education, Northeast Agricultural University, Harbin 150030, China
2
Food College, Northeast Agricultural University, Harbin 150030, China
*
Author to whom correspondence should be addressed.
Foods 2023, 12(16), 2988; https://doi.org/10.3390/foods12162988
Received: 27 June 2023 / Revised: 3 August 2023 / Accepted: 4 August 2023 / Published: 8 August 2023
(This article belongs to the Special Issue Probiotics: Selection, Cultivation, Evaluation and Application)

Abstract

:
In this study, the antioxidant properties of intact cells (IC), cell-free supernatant (CFS), and cell-free extracts (CFE) and whole genome sequencing of Bifidobacterium bifidum E3 (B. bifidum E3), as well as the structural characteristics and antioxidant properties of EPS-1, EPS-2, and EPS-3, were evaluated. The results revealed that intact cells (IC), cell-free supernatant (CFS), and cell-free extracts (CFE) had potent DPPH (1,1-Diphenyl-2-picrylhydrazyl radical), hydroxyl, and superoxide anion radical scavenging capacities, among which CFS was the best. At the genetic level, we identified a strong carbohydrate metabolism capacity, an EPS synthesis gene cluster, and five sugar nucleotides in B. bifidum E3. Therefore, we extracted cEPS from B. bifidum E3 and purified it to obtain EPS-1, EPS-2, and EPS-3. EPS-1, EPS-2, and EPS-3 were heteropolysaccharides with an average molecular weight of 4.15 × 10⁴ Da, 3.67 × 10⁴ Da, and 5.89 × 10⁴ Da, respectively. The EPS-1 and EPS-2 are mainly comprised of mannose and glucose, and the EPS-3 is mainly comprised of rhamnose, mannose, and glucose. The typical characteristic absorption peaks of polysaccharides were shown in Fourier transform infrared spectroscopy (FT-IR spectroscopy). The microstructural study showed a rough surface structure for EPS-1, EPS-2, and EPS-3. Furthermore, EPS-1, EPS-2, and EPS-3 exhibited potent DPPH, hydroxyl, and superoxide anion radical scavenging capacities. Correlation analysis identified that antioxidant capacities may be influenced by various factors, especially molecular weight, chemical compositions, and monosaccharide compositions. In summary, the EPS that was produced by B. bifidum E3 may provide insights into health-promoting benefits in humans.

1. Introduction

As Gram-positive bacteria, Bifidobacterium are an important member of the human gastrointestinal tract (GIT) microbiota and are part of the predominant gut microbiota of breastfed infants [1]. Some Bifidobacterium are safe, making their use as probiotics in pharmaceuticals and dairy products more common [2]. The purpose of studying the genomics of probiotics is to deeply understand the diversity and evolution of probiotics and try to uncover their molecular basis for health promotion [3]. Bifidobacterium are considered commensal microbes of the mammalian gut; many genes exist in their genomes, and these genes were predicted to encode enzymes [4]. In the perspective of genomics, genes involved in cEPS biosynthesis are usually clustered within specific genetic loci (commonly referred to as eps clusters) within members of the Bifidobacterium genus. Comparative genome analyses of different bifidobacterial species showed all analyzed taxa had at least one EPS locus, besides some B. bifidum strains [5].
Exopolysaccharides (EPS) are extracellular polymers that are commonly found in plants, animals, microorganisms, and other organisms. The EPS produced by lactic acid bacteria (LAB) has attracted widespread attention from people. As metabolites of probiotics, EPS can affect the flavor and texture of fermented products and the probiotic function [6]. It is reported that LAB-produced EPS have immune-enhancing, antioxidant, anti-cancer, anti-inflammatory, cholesterol-lowering, and antiviral effects [7]. The functional properties of polysaccharides (biological capacity and physicochemical properties) are closely linked with their structural characteristics (molecular weight (Mw), monosaccharide composition, glycosidic bonds, functional groups, and substituents, et al.) and complexity [8]. The relationship between EPS structure and its functional properties is currently not very clear. Therefore, it is crucial to characterize the chemical structures of LAB-EPS before exploring its functional properties.
Oxidative stress is caused by an imbalance between the production of oxidants and antioxidant defenses. Oxidative stress caused by excessive oxidation will accelerate aging, trigger inflammation, and reduce autoimmunity, thereby resulting in oxidative damage [9]. Exopolysaccharides that are isolated from lactic acid bacteria, such as Lactiplantibacillus plantarum (KX041), have antioxidant properties [10]. Inturri et al. [11] reported the chemical constituents of EPS produced by Bifidobacterium longum W11 and characterized its potential beneficial effects preliminarily, especially the antioxidant properties. Functional foods have attracted increasing attention, especially with the addition of probiotics to dairy products [12]. A study has shown that milk fermented with Lactiplantibacillus plantarum ATCC8014 has in vitro antioxidant properties with 14.7–48.9% DPPH capacity [13]. Therefore, it is very important to discover natural antioxidants that have no adverse impacts on human health.
The purpose of this study was to investigate the physical properties of EPS-1, EPS-2, and EPS-3 by ultraviolet-visible (UV-vis) spectrophotometry, FT-IR spectroscopy, congo red, and field emission scanning electron microscopy (FE-SEM). Meanwhile, the antioxidant capacities of IC, CFE, CFS, cEPS, EPS-1, EPS-2, and EPS-3 were also investigated. This study may help us further our understanding of the potential applications of functional foods and investigate the relationship between their structure and biological capacity.

2. Materials and Methods

2.1. Culture of Strain

B. bifidum E3 used in the current study was provided by Northeast Agricultural University (Harbin, China) and inoculated (3% v/v) into the MRS broth (Hopebio Company, Qingdao, China, HB0384-5) supplemented with 2% v/v L-cysteine hydrochloride (Biotopped Technology Co., Ltd., Beijing, China) at 37 °C for 24 h under the anaerobic condition. The strain was subcultured twice and then centrifuged (5000× g) for 10 min. The experimental supernatant was CFS. The precipitates from centrifugation were washed with PBS buffer three times, and B. bifidum E3 was resuspended with PBS (pH 7.4) buffer to achieve a final concentration of 1 × 10⁹ CFU/mL. The precipitates of the strains were the IC of the experiment. CFE was extracted by ultrasonic crushing of the IC. The treatment was performed under ultrasonic conditions at a power of 800 W for 3 s, stopped for 5 s, and continued for 15 min. All experimental samples were directly used for follow-up experiments.

2.2. Whole Genome Sequencing

The library was built from the DNA extracted from B. bifidum E3 and sequenced on the Illumina and PacBio RS II platforms. The Unicycler software was used to integrate and assemble data (https://github.com/rrwick/Unicycler (accessed on 20 October 2022)) and obtain the assembly results. The assembly results were aligned with known sequences in the NCBI to obtain the final assembled sequence. The genome circle map was drawn by CGView Server (http://cgview.ca/ (accessed on 22 October 2022)). KAAS (https://www.genome.jp/tools/kaas/ (accessed on 22 October 2022)) and WebMGA (http://weizhong-lab.ucsd.edu/webMGA/ (accessed on 22 October 2022)) websites were used to compare with the Kyoto Encyclopedia of Genes and Genomes (KEGG) and Cluster of Orthologous Groups (COG) of proteins to obtain the corresponding functional annotation information. The genome sequence was submitted to the National Center for Biotechnology Information (NCBI, Bethesda, MD, USA) database, and the NCBI prokaryotic genome annotation pipeline was used to annotate the whole genome (http://www.ncbi.nlm.nih.gov/books/NBK174280/ (accessed on 22 October 2022)).

2.3. Isolation and Purification of cEPS

The cold ethanol precipitation was used for EPS extraction [14]. Briefly, the CFS of B. bifidum E3 was inactivated in boiling water (100 °C) for 10 min and then cooled to room temperature. Proteins were precipitated by adding 80% (w/v) trichloroacetic acid (TCA) to the fermentation supernatant to achieve a final concentration of 4% (w/v). Furthermore, the above solution was incubated overnight at 4 °C and centrifuged at 5000× g for 20 min to obtain the supernatant. The supernatant was rotary evaporated and mixed with triple volumes of absolute ethanol to obtain the precipitate. Afterwards, the precipitate was dissolved in an appropriate amount of deionized water and dialyzed (8–14 kDa) at 4 °C for 48 h, followed by freeze-drying. Subsequently, the cEPS were purified by DEAE-Cellulose 52 eluting with deionized water and 0.1 and 0.3 mol/L NaCl at a flow rate of 1 mL/min, sequentially. Moreover, sephadex G-100 columns were used to elute NaCl (0.1 mol/L) at a flow rate of 0.5 mL/min to obtain EPS-1, EPS-2, and EPS-3.

2.4. Chemical Composition, Monosaccharide Composition, and Molecular Weight

The contents of neutral sugar, protein, uronic acid, and sulfate of EPS-1, EPS-2, and EPS-3 were determined according to the methods of phenol-sulfuric acid colorimetric [15], coomassie brilliant blue [16], sulfate-carbazole [17], and barium chloride-gelatin [18], with glucose, bovine serum albumin, galacturonic acid, and potassium sulfate as standards, respectively.
EPS-1, EPS-2, and EPS-3 were obtained according to Annadurai et al.’s method. [19]. The aqueous layer was filtered through 0.45-micrometer membranes. The quantitative analysis of monosaccharide composition was completed by the HPLC system (Agilent Technologies, Boeblingen, Germany). Acetonitrile and phosphate buffer (0.1 M, pH 6.7) were used as mobile phases (81:19) with a flow rate of 1.0 mL/min and an injection volume of 20 μL at a column temperature of 25 °C, and the detection wavelength was 245 nm. The monosaccharides of EPS-1, EPS-2, and EPS-3 were determined by measuring their retention time compared to standard sugars. Following that, the molar ratios of monosaccharide components were calculated.
Mw of EPS-1, EPS-2, and EPS-3 were determined by HPGPC according to the method of Mao et al. [20] with minor modifications. EPS-1, EPS-2, and EPS-3 (5 mg/mL) were centrifuged at 12,000 rpm for 10 min, and the supernatant was filtered through a 0.22 μm microporous membrane. The detection was performed with a RI-10A differential detector (Shimadzu, Kyoto, Japan), in which the column temperature was 40 °C, the injection volume was 20 μL, and the flow rate was 0.6 mL/min. Dextran MW standards from 1–670 kDa were used for the MW calibration.

2.5. Ultraviolet-Visible (UV-Vis) Spectrophotometry and Fourier-Transform Infrared (FT-IR) Spectroscopy

A UV-2600 spectrophotometer (Unico, Shanghai, China) was used to measure the absorption of EPS-1, EPS-2, and EPS-3 (1 mg/mL) from 190 to 500 nm. EPS-1, EPS-2, and EPS-3 (1 mg) were added with potassium bromide (KBr, 100 mg), then they were pressed into 1 millimeter-thick pellets for measurement. Moreover, an FT-IR spectrometer (Bruker Vetex70, Karlsruhe, Germany) was used to scan in the range of 4000–400 cm−1 [21].

2.6. Congo Red Test

The triple-helix structures of EPS-1, EPS-2, and EPS-3 were examined as follows: EPS-1, EPS-2, and EPS-3 (1 mg/mL) were dissolved in a NaOH solution (0.2 M) containing congo red (40 µM). To observe the changes in maximum absorption wavelength, we scanned the reaction solution in the spectral range of 190–800 nm [22].

2.7. Field Emission Scanning Electron Microscopes (FE-SEM)

A field emission scanning electron microscope (FE-SEM) (Hitachi S-4800, Hitachi, Tokyo, Japan) was used to analyze the apparent morphology of EPS-1, EPS-2, and EPS-3. In short, EPS-1, EPS-2, and EPS-3 were connected to an aluminum rod for gold sputtering and then observed at an accelerating voltage of 5 kV [23].

2.8. DPPH Radical Scavenging Assay

One milliliter of samples (IC, CFE, CFS, cEPS, EPS-1, EPS-2, and EPS-3) were added to 1 mL of DPPH (0.2 mmol/L), respectively. The mixture reacted in the dark at 37 °C for 30 min. After that, the supernatant was centrifuged at 5000× g for 10 min, and the absorbance was measured at 517 nm. The following is the calculation formula for radical scavenging [24]:
DPPH   radical   scavenging   ( % ) = ( 1     S a m p l e   O D 517 B l a n k   O D 517 C o n t r o l   O D 517 )   ×   100
In the formula, DPPH solution dissolved in anhydrous ethanol was added to the blank group, while PBS was used to replace the sample in the control group, and other reaction conditions were the same.

2.9. Hydroxyl Radical Scavenging Assay

The hydroxyl radical scavenging test kit (No. A018-1-1; Nanjing Jiancheng Bioengineering Institute, Nanjing, China) was used to determine the hydroxyl radical scavenging capacity of samples (IC, CFE, CFS, cEPS, EPS-1, EPS-2, and EPS-3). The following is the calculation formula for radical scavenging:
Hydroxyl   radical   scavenging   capacity   ( % ) = C o n t r o l   O D 550 S a m p l e   O D 550 C o n t r o l   O D 550 B l a n k   O D 550   ×   100

2.10. Superoxide Anion Radical Scavenging Assay

The reaction solution contained 2.8 mL of Tris-HCl (0.05 mol/L, pH 8.2), 0.1 mL of pyrogallol (0.05 mol/L), and 0.1 mL of IC, CFE, CFS, cEPS, EPS-1, EPS-2, and EPS-3 at room temperature to avoid light reactions for 4 min. Furthermore, 1 mL of hydrochloric acid (8 mol/L) terminated the reaction, and the absorbance of the final solution was measured at 320 nm [10]. The following is the calculation formula for radical scavenging:
Superoxide   anion   radical   scavenging   capacity   ( % ) = ( 1     S a m p l e   O D 320 B l a n k   O D 320 )   ×   100
Deionized water was used instead of samples in the blank group.

2.11. Statistical Analysis

All data were exhibited as mean ± standard deviation (n = 3) and analyzed by one-way analysis of variance (ANOVA) using SPSS 18.0 software (SPSS Inc., Chicago, IL, USA). Graphs were drawn with GraphPad Prism 8.0.2 (GraphPad Software, La Jolla, CA, USA). In all results, p < 0.05 was considered to be a significant difference, and p > 0.05 was considered not to be a significant difference.

3. Results and Discussion

3.1. Antioxidant Capacity of IC, CFE, and CFS

The antioxidant capacities of IC, CFE, and CFS were demonstrated in Figure 1. The scavenging capacities of IC, CFE, and CFS for DPPH radical, hydroxyl radical, and superoxide anion radical ranged from 18.33% to 98.07%. CFS had the highest scavenging capacities with 83.08% ± 2.02%, 95.68% ± 1.60%, and 48.20% ± 0.55% for DPPH radical, hydroxyl radical, and superoxide anion radical, which were significantly higher than IC and CFE (p < 0.05). The scavenging capacities of DPPH radical, hydroxyl radical, and superoxide anion radical of IC were 37.07% ± 0.78%, 77.63% ± 0.74%, and 28.72% ± 1.11%. Meanwhile, the three scavenging capacities of IC were significantly higher than those of CFE (p < 0.05). Ma et al. [25] found that CFS of Bifidobacterium infantis YLGB-1496 scavenged 41.18%, 102.38%, and 24.88% of DPPH radical, hydroxyl radical, and superoxide anion radical, respectively. The scavenging capacity of B. bifidum E3 was higher than that of Bifidobacterium infantis YLGB-1496 for DPPH radical and superoxide anion radical. Zhao et al. [26] found that Bifidobacterium longum subspecies exhibited free radical scavenging ability, especially CFS, which showed higher antioxidant capacity than IC and CFE, which was consistent with our study. The capacity of CFS to scavenge radicals may be related to the metabolites. Exopolysaccharide is one of the metabolites in CFS. Therefore, we focused on analyzing the basic genomic information of B. bifidum E3, especially in the genes of its sugar transport system and the cluster of exopolysaccharides.

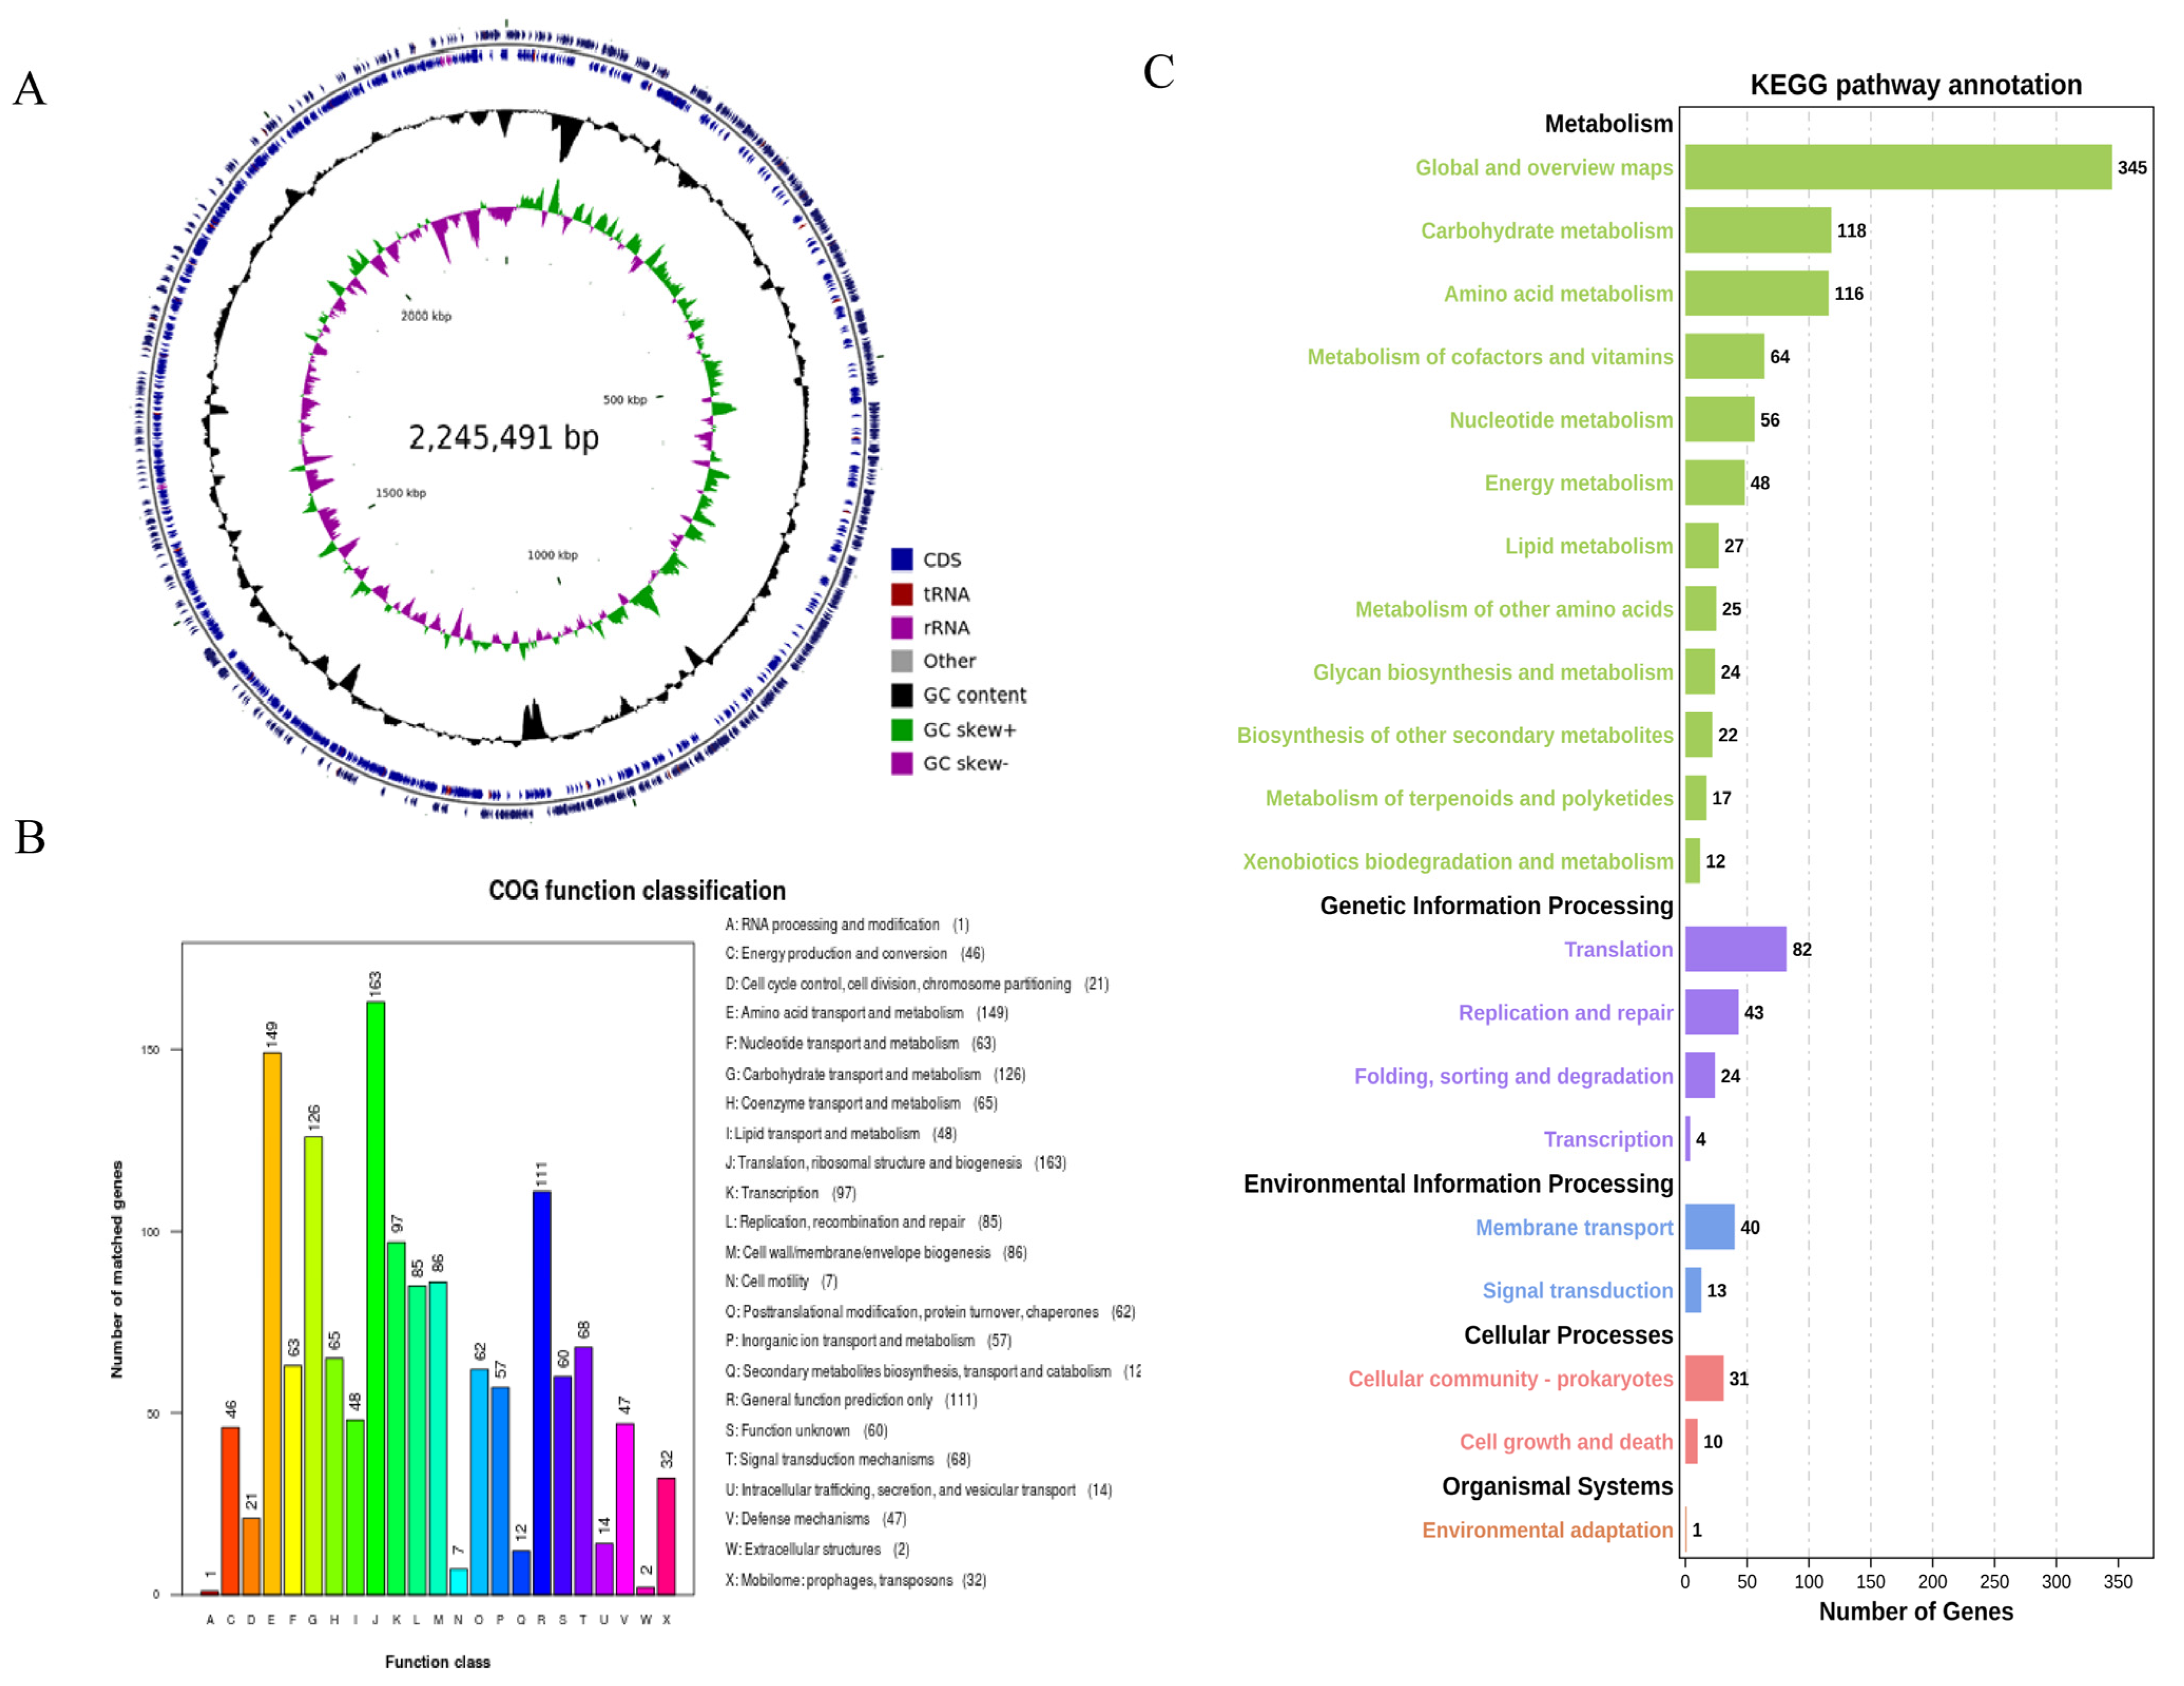
3.2. Analysis of the Genome

3.2.1. Genome Composition

The genome of B. bifidum E3 had no plasmids and only consisted of a circular chromosome (2,245,491 bp) with a G + C content of 62.75%. The genome predicted 1878 genes with a total length of 1,945,738 bp, and the total length of the coding regions was 86.65% of the whole genome. Among them, the average length of coding genes was 1036 bp. In addition, 1818 CDSs were predicted in the genome. There were 53 tRNAs, 1 tmRNA, and 6 rRNA (16 s and 23 s) gene operons without sRNA (Figure 2A).

3.2.2. Analysis of COG and KEGG

The result of COG annotation is shown in Figure 2B. There were 1422 genes that could be assigned to COG families, comprising 23 functional categories. There were 1, 46, 21, 149, 63, 126, 65, 48, 163, 97, 85, 86, 7, 62, 57, 12, 111, 60, 68, 14, 47, 2, and 32 genes annotated to categories A to X, respectively. Among them, a large number of genes were annotated in four categories: translation, ribosomal structure, and biogenesis (11.46%), amino acid transport and metabolism (10.48%), carbohydrate transport and metabolism (8.86%), and general function prediction only (7.81%).
The classification of genes that code for proteins in the KEGG pathway in the genome of B. bifidum E3 was obtained through KAAS annotation (Figure 2C). A total of 1122 genes were identified, assigned to 116 KEGG pathways, and divided into five categories. The pathways with the most annotated genes were global and overview maps (30.75%), carbohydrate metabolism (10.52%), and amino acid metabolism (10.34%). Secondly, more genes were involved in transcription (7.31%) and the metabolism of cofactors and vitamins (5.70%). Therefore, it was important to understand the relevance of carbohydrate metabolism to function. Next, we investigated the synthesis of exopolysaccharides from a genomic perspective as well as their relationship with in vitro antioxidant capacities.

3.3. Sugar Transport System

In general, carbohydrates are transported in three ways: phosphotransferase systems (PTS), sugar penetration, and ABC-type sugar transfer systems. The PTS system is the main transport method and consists of histidine phosphate carrier protein (HPr), enzyme I (EI), and sugar-specific enzyme II (EII). The analysis of the sugar transport system of B. bifidum E3 is shown in Table 1. In the genome, genes E3_01768 and E3_01767 encode HPr and EI. B. bifidum E3 had 4 EIIs related to the PTS system. They were EIIB of transport sugar (E3_01751), EIIA of glucose (E3_00280), EIIABC of N-acetylglucosamine (E3_00281), and EIIABC of fructose (E3_01538). One gene (E3_01046) encoded the permease of the ABC-type sugar transport system, and three genes (E3_01045, E3_01047, and E3_01393) encoded multiple sugar transport system permease proteins in the genome of B. bifidum E3. In addition, the galactose permease encoded by gene E3_01493 could transport lactose, the fructose permease encoded by gene E3_01538 could transport fructose, and the lactose permease encoded by gene E3_01046 could transport lactose. The above analysis showed that B. bifidum E3 could transport lactose, fructose, glucose, N-acetylglucosamine, and galactose, which formed the substrate for the synthesis of sugar nucleotides and activated precursors for EPS synthesis.

3.4. Synthesis of Sugar Nucleotides and Gene Cluster

The synthesis process of EPS is divided into two stages: the synthesis of precursor sugar nucleotides and EPS gene clusters. As shown in Figure 3A, lactose could be hydrolyzed into glucose and galactose by beta-galactosidase (E3_00203). Galactose was transformed into glucose-1-phosphate through galactokinase (E3_00446) and UDP-glucose-hexose-1-phosphate uridylyltransferase (E3_00445). Glucose was transported into the cell by the transport system, and glucose-6-phosphate was formed by the action of glucokinase (E3_00603). Partial glucose 6-phosphate was transformed into glucose 1-phosphate by phosphoglucomutase (E3_01543) and formed UDP-glucose through UDP glucose pyrophosphorylase (E3_00967). UDP-galactose and UDP-glucose could be converted into each other in the presence of UDP-galactose-4-epimerase (E3_0047). Glucose-1-phosphate could also be catalyzed by dTDP-glucose 4,6-dehydratase (E3_00046), dTDP-4-dehydrorhamnose 3,5-epimerase (E3_00071), and dTDP-4-dehydrorhamnose reductase (E3_00749) to synthesize dTDP-L-rhamnose. The PTS system transported fructose into the cytoplasm, and then fructose-1-phosphate was converted to fructose-6-phosphate by glucosamine-6-phosphate deaminase (E3_00604). Fructose-6-phosphate was transformed into UDP-N-acetyl-α-D-glucosamine through phosphoglucosamine mutase (E3_00477), glucosamine-1-phosphate N-acetyltransferase (E3_01113), and UDP-N-acetylglucosamine pyrophosphorylase (E3_01113). Meanwhile, fructose-6-phosphate was converted to GDP-mannose under mannose-6-phosphate isomerase (E3_00393), phosphomannomutase (E3_00477), and mannose-1-phosphate guanylyltransferase (E3_00879). These nucleotide sugars might be assembled into the repeating units of EPS.
Most EPS-producing microorganisms have genes encoding for the synthesis of EPS clustered in their genomes or large plasmids. As shown in Figure 3B, B. bifidum E3 had one EPS synthesis gene cluster consisting of 20 genes. The cluster of EPS genes was related to the encoding of transposase (E3_00050, E3_00052, and E3_00054-57), rhamnose precursors (E3_00046 and E3_00071), ABC transporters (E3_00065 and E3_00066), acyltransferase (E3_00060), UDP-galactopyranose mutase (E3_00068), and glycosyl transferase (E3_00049, E3_00061, and E3_00067). Glycosyl transferase plays a crucial role in determining the monosaccharide composition of EPS [27]. Transposase facilitates the stabilization of exopolysaccharide gene clusters, which indicates the possibility of horizontal gene transfer between B. bifidum E3 and other strains. The effect of these genes on the chemical structures and functions of B. bifidum E3 EPS remains to be determined. Meanwhile, we also found a large number of hypothetical proteins in the gene cluster. Furthermore, we investigated the physical properties and antioxidant capacities of the exopolysaccharide of B. bifidum E3.

3.5. Antioxidant Capacity of cEPS

The antioxidant properties of cEPS from the B. bifidum E3 metabolite are shown in Figure 4. It was found that the scavenging capacities of DPPH radical, hydroxyl radical, and superoxide anions of cEPS significantly increased with increasing cEPS concentration, respectively. The antioxidant property of cEPS (4 mg/mL) was the highest compared to the concentration of 0.5–2 mg/mL. The scavenging abilities of DPPH and superoxide anions radicals of cEPS (4 mg/mL) were significantly different at concentrations of 0.5 and 1 mg/mL (p < 0.05). Similarly, the scavenging ability of hydroxyl radicals at each cEPS concentration was significantly different (p < 0.05). cEPS may have strong radical scavenging capacities due to its antioxidant components, such as protein and trace elements. Li et al. [28] found the antioxidant properties of cEPS from Lactococcus lactis subsp. lactis IMAU11823 were higher than their purified fractions, and cEPS had excellent antioxidant properties, which was consistent with our study. As a result, cEPS might be beneficial to the reduction of oxidative stress caused by substances, such as radicals and reactive oxygen species, with the potential to be a natural antioxidant.

3.6. Yield, Chemical Compositions, Monosaccharide Compositions, and Molecular Weight

The basic components of EPS-1, EPS-2, and EPS-3 are presented in Table 2. The cEPS yield of B. bifidum E3 was 429.78 mg/L. A study indicated that the greatest EPS yield of Bifidobacterium bifidum WBIN03 was 241.20 mg/L in MRSc medium [29]. Therefore, B. bifidum E3 produced a much higher level of cEPS compared with Bifidobacterium bifidum WBIN03. Three components were obtained by purifying cEPS, and the purification rates of EPS-1, EPS-2, and EPS-3 were 29.33%, 23.00%, and 10.67%, respectively. The final yields of Lactobacillus rhamnosus ZFM231 were 18.65% (EPS-1), 22.52.0% (EPS-2), 16.75% (EPS-3), and 17.58% (EPS-4), respectively [30]. The EPS-1 and EPS-2 yields of B. bifidum E3 were higher than those of Lactobacillus rhamnosus ZFM231, while the yield of EPS-3 was lower than that of Lactobacillus rhamnosus ZFM231. The neutral sugar constituted a major proportion in EPS-1, EPS-2, and EPS-3: 90.53 ± 0.52%, 89.16 ± 1.34%, and 72.47 ± 2.81%, respectively. In contrast, the protein content of EPS-1, EPS-2, and EPS-3 was low. The uronic acid contents of EPS-1, EPS-2, and EPS-3 were significantly different from each other (p < 0.05), and EPS-3 had the highest content of 0.94 ± 0.07. The sulfate contents of EPS-2 and EPS-3 were not significantly different (p > 0.05), but they were significantly different (p < 0.05) when compared with EPS-1. The EPS produced by L. helveticus MB2-1 contained 5.24% and 0.47% of uronic acid and sulfate, respectively [31]. The uronic acid contents of EPS-1, EPS-2, and EPS-3 obtained in our experiment were lower than in situ EPS produced by L. helveticus MB2-1, but the sulfate contents of them were higher than L. helveticus MB2-1.
The monosaccharide composition of EPS-1, EPS-2, and EPS-3 produced by B. bifidum E3 was investigated by HPLC. The analysis results for the monosaccharide composition are shown in Table 2. EPS-1 was mainly comprised of mannose and glucose, and its molar ratio was approximately 1:5.04. EPS-2 was mainly comprised of rhamnose, mannose, and glucose; its molar ratio was approximately 0.32:1:1.56. EPS-1 produced by Lactococcus lactis subsp. lactis IMAU11823 was composed of glucose and mannose with a molar ratio of 7.01:1.00, whereas EPS-2 was composed of mannose, glucose, and rhamnose with a molar ratio of 7.45:1.00:2.34 [28]. The monosaccharide composition was consistent with our study. ESP-3 was mainly comprised of rhamnose, mannose, glucosamine, galactose, glucose, and glucuronic acid; its molar ratio was approximately 1.10:1:0.82:1.05:1.39 and 0.68, suggesting that it could be an acidic polysaccharide. There are few reports on the monosaccharide composition of bacterial polysaccharides. However, it was found in a study that EPS364 (charged exopolysaccharide of novel deep-sea bacteria) was composed of mannose, glucosamine, glucose, galactosamine, and arabinose in a molar ratio of 5:9:3.4:0.5:0 [32]. Studies indicated that polysaccharides containing mannose in the composition of monosaccharides had the potential function of lowering blood sugar and inhibiting the growth of tumors [33]. The above results showed that the species of strains might affect the monosaccharide composition and proportion of EPS.
It has been reported that the molecular weight range of EPS in lactic acid bacteria is 104–106 Da [34]. The molecular weights of EPS-1, EPS-2, and EPS-3 in this experiment were 4.15 × 10⁴ Da, 3.6 × 10⁴ Da, and 5.89 × 10⁴ Da, respectively. Molecular weight is an essential property of EPS that may affect probiotics. High-molecular-weight EPS is stronger than low-molecular-weight EPS in improving the texture of fermented milks and their anti-tumor activity [35]. Furthermore, the differences between Mws of different EPSs may be related to their specific functions.

3.7. UV-Vis Spectrophotometry and FT-IR Spectroscopy

To verify whether EPS-1, EPS-2, and EPS-3 contain nucleic acids and proteins, the three components were scanned by the UV-vis spectrum in the wavelength range of 190–500 nm. The results showed that there was only one absorption peak around 200 nm. The three components had no absorption peaks at 260 nm and 280 nm wavelengths (Figure 5A). Therefore, there were no nucleic acids and very little protein in the three components.
FT-IR spectroscopy is a useful analytical method for studying biopolymers’ structures and functional groups. The FTIR spectra of EPS-1, EPS-2, and EPS-3 are shown in Figure 5B. EPS-1, EPS-2, and EPS-3 had characteristic absorption peaks of typical polysaccharides, such as 3396.85 cm−1, 3377.78 cm−1, and 3365.99 cm−1, which were associated with the carbohydrate hydroxyl groups. Many hydroxyl groups are shown at peaks of 3200–3600 cm−1. The peaks at 2928.75 cm−1, 2929.59 cm−1, 2926.71 cm−1, and 1654.26 cm−1, 1666.73 cm−1, and 1654.76 cm−1 in the three components were due to the stretching vibration of C-H and C = O groups in the sugar ring [36]. The absorbance in the 1700-1550 cm−1 region may be due to the presence of uronic acid. The peak at 1370.01 cm−1 and 1332.34 cm−1 in EPS-1 and EPS-2 might be attributable to the stretching vibration of -CH3 [37]. Some weak stretching peaks at 1242.81 cm−1, 1239.25 cm−1 in EPS-2 and EPS-3, and the sharp peaks at 1027.06 cm−1, 1027.93 cm−1, and 1076.99 cm−1 in EPS-1, EPS-2, and EPS-3 suggested the existence of carboxylic acids and C-O stretching vibrations of ester groups [38]. Ayyash et al. indicated that the wave number region 1250-1000 cm−1 is attributed to the existence of carbohydrates, and peaks in this region belong to C-O-C and C-O-H glycosidic bands [39]. Additionally, the peak at 830.04 cm−1 in EPS-2 might indicate the presence of a mannose ring, which is consistent with monosaccharide composition. Weak peaks observed at 679.84 cm−1 and 608.70 cm−1 in EPS-2 and EPS-3 demonstrated the variation of the C-H bend group at 700–600 cm−1. The weak peaks at 579.16 cm−1 and 575.73 cm−1 might result from sulfate groups, which were in accordance with the result of Di et al. [40] These results indicated that the FT-IR spectroscopy of EPS-1, EPS-2, and EPS-3 had the main characteristics of polysaccharides.

3.8. Field Emission Scanning Electron Microscope

FE-SEM is a helpful tool for studying the surface and three-dimensional morphologies of biological macromolecules and helps to understand the physical properties of polysaccharides. The apparent morphology and physicochemical properties of polysaccharides were observed by FE-SEM and shown in Figure 5C-E. The additional details of the EPS microstructure can be seen after the microscopic images at 10,000× magnification, showing a rough and lumpy surface. A dense and porous sponge structure composed of irregularly shaped particles was observed in EPS-1, giving the polysaccharide water retention capacity. The MSR101 strain had a similar structure to that of EPS-1 [41]. EPS-2 had many uniform flake and rod-shaped structures, revealing a compact structure with a rough surface. The microscopic morphology of EPS-3 showed a block-like structure with an uneven surface. It was similar to the appearance of the exopolysaccharide produced by Tibetan kefir grains during the fermentation of milk [42]. The differences in morphology between EPS-1, EPS-2, and EPS-3 might be related to the composition and structure of monosaccharides.

3.9. Colorimetric Determination of Triple Helix Structures

In the weak alkaline solution, polysaccharides with tripartite helix structures will form complexes with congo red. The complexation is related to a bathochromic shift in the maximum absorption wavelength of the congo red spectrum. The results showed that EPS-1 and EPS-2 have no notable bathochromic shift, indicating the absence of a triple helix arrangement (Figure 5F). Polysaccharides extracted from L. mesenteroides DRP105 showed the same conformation [43]. However, the maximum absorption wavelength difference between EPS-3 + congo red and congo red was 9 nm. It indicated that EPS-3 might have a triple helix structure. It was consistent with our study that exopolysaccharide (cEPS) produced by Lactobacillus helveticus MB2-1 exhibited a significant bathochromic shift of approximately 20 nm in the λmax [22]. Triple helices in polysaccharides might be associated with biological capacity.

3.10. Antioxidant Capacity of EPS-1, EPS-2, and EPS-3

The antioxidant capacities of EPS-1, EPS-2, and EPS-3 showed dose-dependent responses with increasing concentration, and EPS-3 exhibited the greatest capabilities in scavenging radicals (Figure 6A–C). The scavenging capacities of DPPH radicals in EPS-2 and EPS-3 were significantly increased from 2.8% to 53.64% at a concentration of 0.5–4 mg/mL (p < 0.05). However, there were no significant differences at concentrations of 1–4 mg/mL of EPS-1 (p > 0.05). The scavenging DPPH radical abilities of ST-EPS1, ST-EPS2, and ST-EPS3, which are produced by Streptococcus thermophilus CGMCC 7.179, were 47.11%, 70.18%, and 41.79% at 10 mg/mL, respectively [44]. EPS-3 (4 mg/mL) of B. bifidum E3 was higher than ST-EPS1 and ST-EPS3 on the scavenging capacity of DPPH radicals. DPPH radicals are considered stable radicals that maintain their stability by accepting electrons or hydrogen groups, which means that EPS-1, EPS-2, and EPS-3 might be good electron or hydrogen acceptors.
The scavenging capacities of hydroxyl radicals in EPS-1, EPS-2, and EPS-3 were significantly increased at concentrations of 0.5–2 mg/mL (p < 0.05). The hydroxyl radical scavenging capacities were 22.95 ± 0.26%, 22.62 ± 1.93%, and 31.15 ± 1.60% for EPS-1, EPS-2, and EPS-3 at 4.0 mg/mL. Xu et al. found the acidic polysaccharide of Bifidobacterium animals RH had better hydroxyl radical scavenging ability than neutral polysaccharide [45]. In this experiment, the hydroxyl radical scavenging capacities of neutral polysaccharides (EPS-1 and EPS-2) were lower than those of acidic polysaccharides (EPS-3), which was consistent with the previous report. The above studies could suggest that EPS-1, EPS-2, and EPS-3 might help to mitigate cellular oxidative damage caused by hydroxyl radicals and alleviate the degree of chronic disease in humans.
EPS-1, EPS-2, and EPS-3 showed significant differences between the concentrations of 0.5 and 4 mg/mL and achieved the maximum superoxide anions radical scavenging capacities (14.50 ± 1.24%, 14.71 ± 1.7%, and 14.89 ± 0.88%) when the concentration was 4 mg/mL, respectively. The scavenging of superoxide anion radicals by EPS was directly correlated with the concentration. However, three components showed little difference in scavenging at the same concentrations. Liu et al. found that the acidic polysaccharide of the purified fraction of Saccharomyces cerevisiae Y3 had significant radical scavenging abilities, with a scavenging rate of 18.80% [46], which was similar to the superoxide anion scavenging rate of EPS-3 (15.42 ± 0.77%). The above research showed that EPS had a superior capacity to scavenge superoxide anion radicals. Therefore, EPS is important for mitigating oxidative stress and oxidative damage.

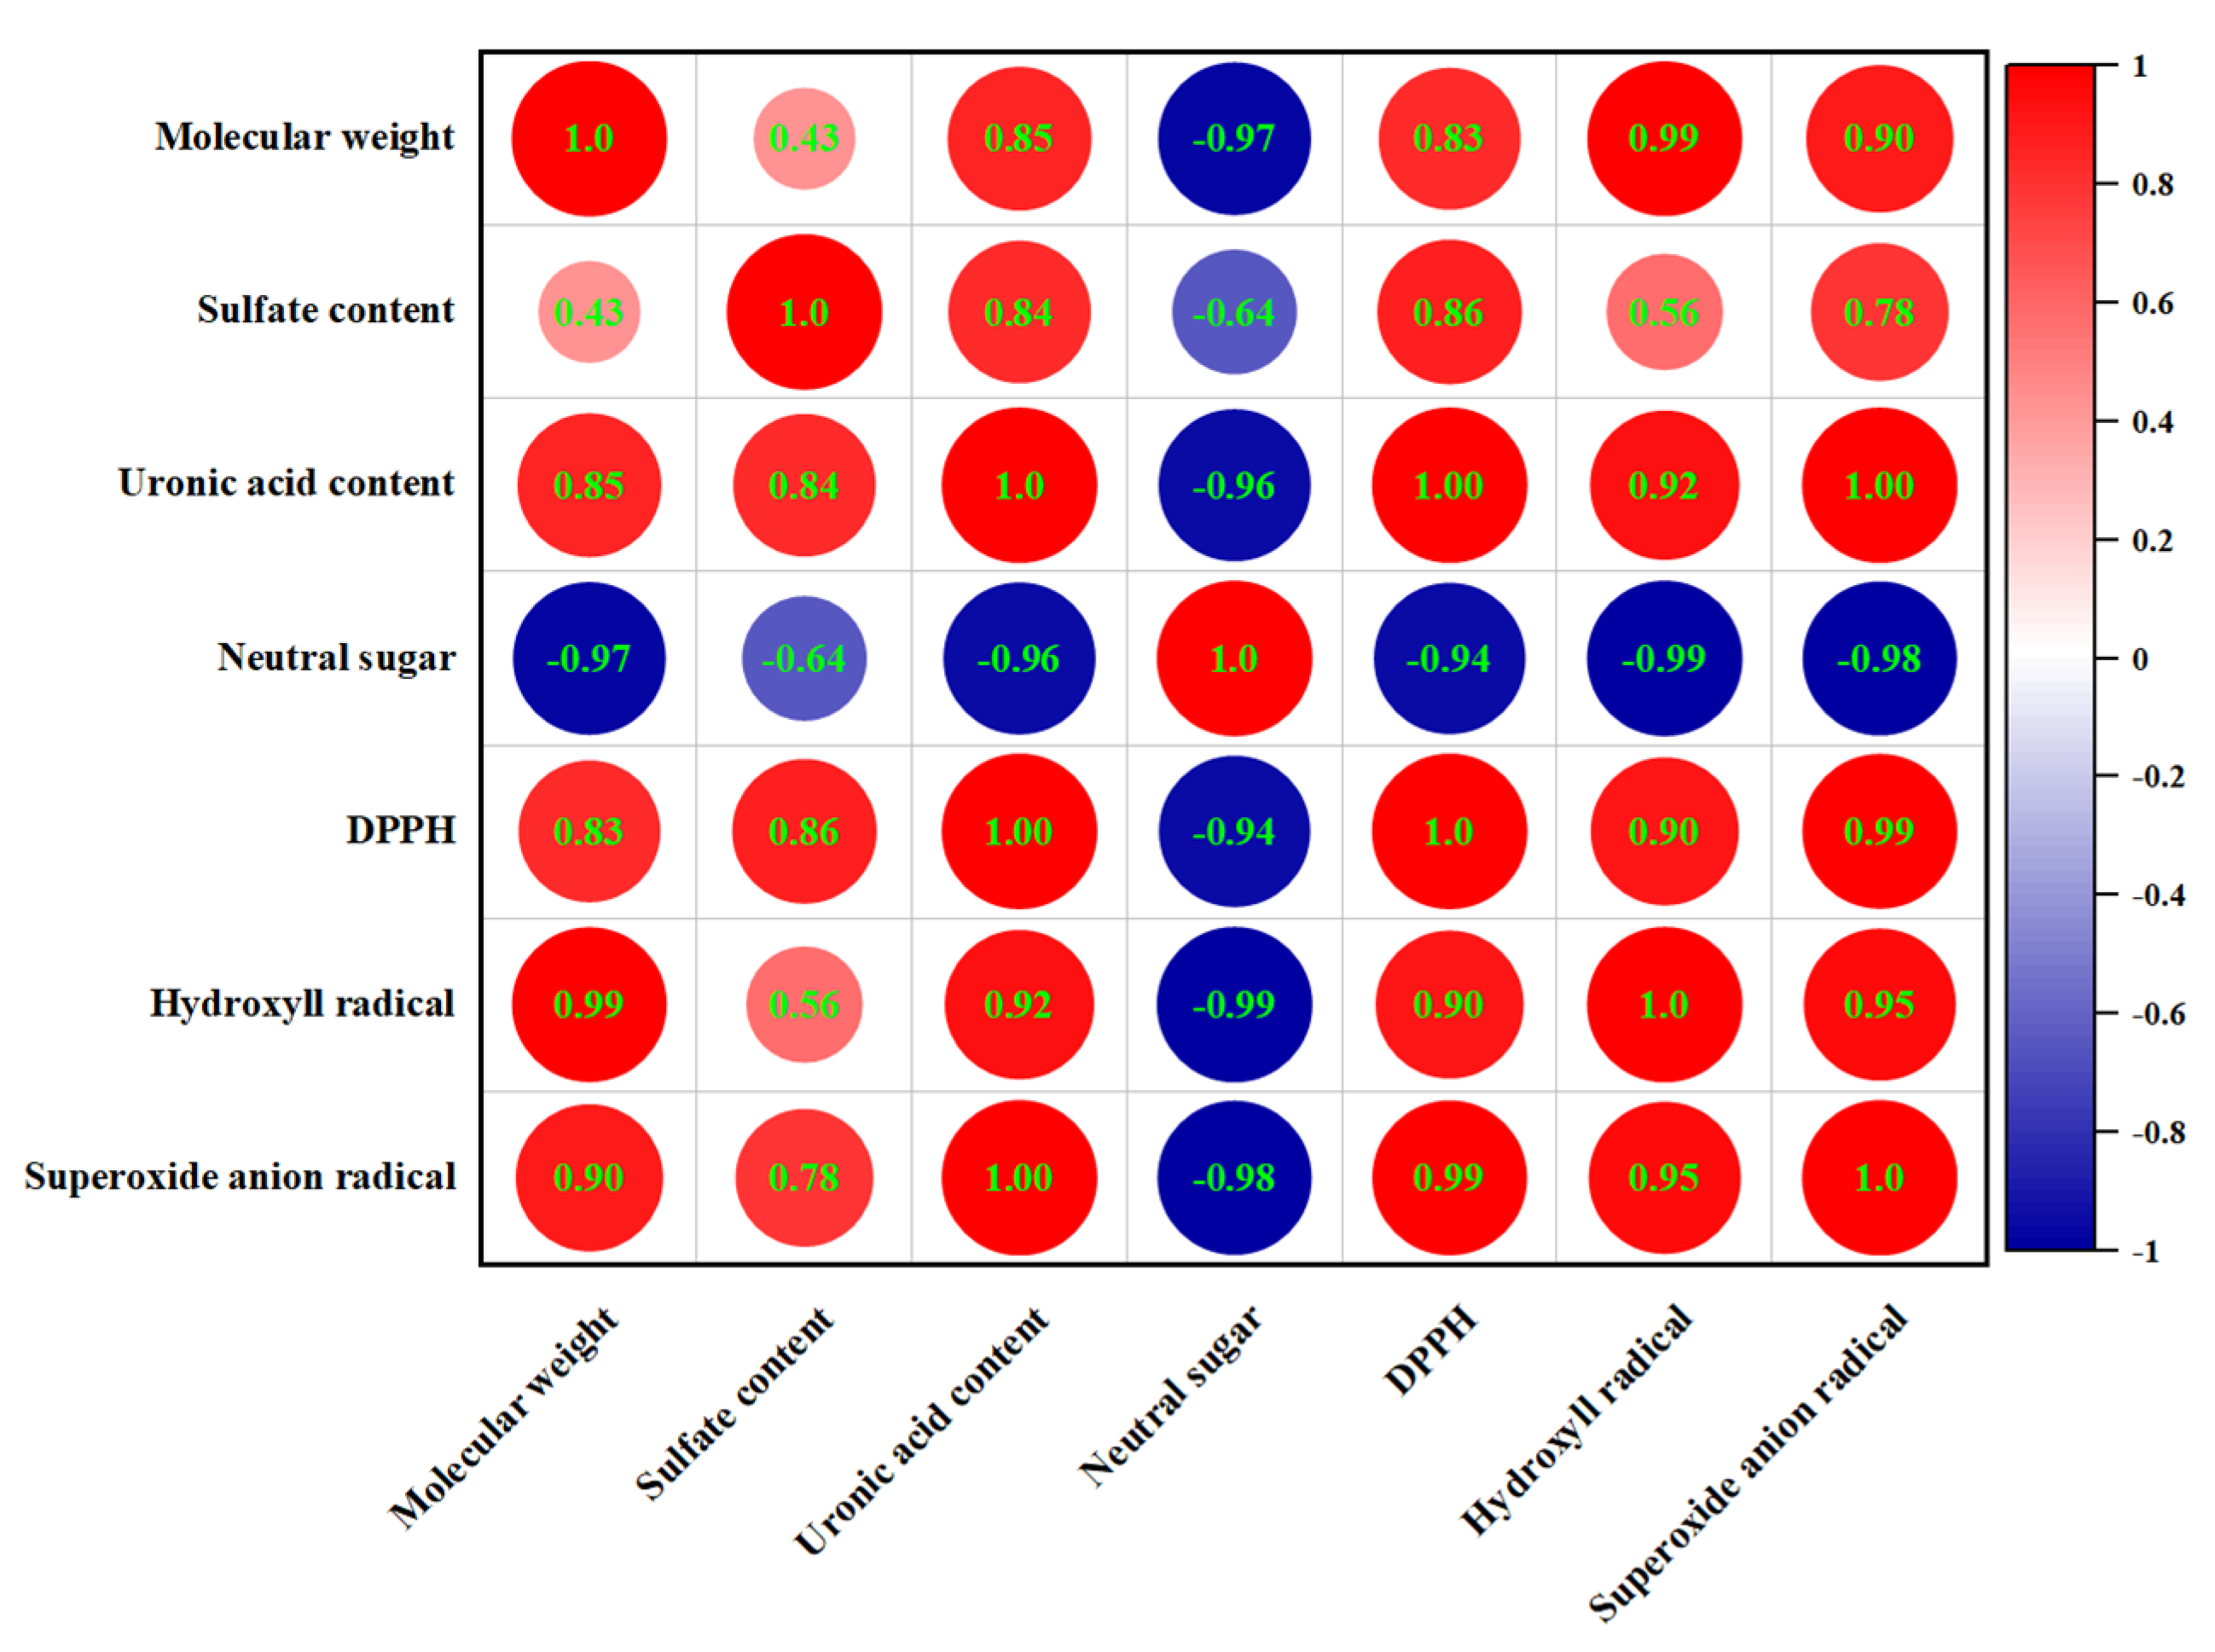
3.11. Correlation Analysis

The Spearman correlation analysis was used to demonstrate the correlations between the chemical composition, molecular weight, and antioxidant capacities of EPSs (Figure 7). There was a negative correlation between the neutral sugar content and antioxidant capacities. In contrast, uronic acid and sulfate contents showed a positive correlation with DPPH, hydroxyl, and superoxide anion radical scavenging capacities; the correlation coefficients were 1.00, 0.92, 1.00, and 0.86, 0.56, and 0.78, respectively. Meanwhile, we found a similar positive relationship between molecular weight and antioxidant capacity. It has been suggested that the strong antioxidant capacities of polysaccharides from cyclina sinensis (CSPS) may be due to their high content of uronic acid, protein, and sulfate [47]. Wang et al. showed that exopolysaccharides with higher sulfate content have higher antioxidant activity [48]. These results were the same as the results of this experiment. In addition, the antioxidant capacities are also closely related to the molecular weight. Exopolysaccharides with a higher molecular weight have larger organic groups than polysaccharides with a lower molecular weight, which contribute to increased antioxidant activity [49]. However, other studies have found that low-molecular-weight EPS can also have high antioxidant capacity [50]. Therefore, the effect of molecular weight on antioxidant properties was complex. The monosaccharide composition of EPS also affects its antioxidant capacity. We explored the correlation between them using multiple linear regression analysis and showed it in the following formula:
DPPH radical scavenging capacity (%) = 3.696 + 0.786 Xmannose + 3.182 Xglucuronic acid
Hydroxyl radical scavenging capacity (%) = 22.319 + 0.018 Xmannose + 0.758 Xglucuronic acid
Superoxide anion radical scavenging capacity (%) = 14.279 + 0.014 Xmannose + 0.081 Xglucuronic acid
The results showed that the increase in DPPH, hydroxyl, and superoxide anion raical scavenging capacities was related to the increase in mannose and glucuronic acid. The positive coefficients in front of Xglucuronic acid were higher than Xmannose, indicating that the presence of glucuronic acid has stronger radical scavenging capacities than mannose. A high molar ratio of mannose in exopolysaccharides extracted from inonotus obliquus enhanced antioxidant capacities [51]. The presence of uronic acid groups could increase the negative charge of polysaccharides on the one hand and effectively scavenge free radicals by activating hydrogen atoms on the other [52]. Thus, it appeared that the antioxidant capacities were attributed to several factors.

4. Conclusions

In the present study, it was found that IC, CFE, and CFS of B. bifidum E3 had potent antioxidant capacities, among which CFS had the highest antioxidant capacity. Meanwhile, B. bifidum E3 showed superior performance in carbohydrate metabolism and exopolysaccharide production in genome analysis. Thus, cEPS of B. bifidum E3 were extracted and purified to explore its structural characteristics and antioxidant capacities. All EPSs were HePSs (primarily containing glucose, mannose, rhamnose, et al.). FTIR exhibited the existence of carboxyl and hydroxyl groups in all EPSs. At the same time, EPS-1, EPS-2, and EPS-3 have different free radical scavenging capacities, which are mainly related to their composition and structure. Therefore, EPS could be utilized as a promising natural antioxidant for application in functional foods. EPSs derived from B. bifidum E3 may provide a paradigm for future study of the structural and functional characteristics of EPS in antioxidants using genomics methods.

Author Contributions

Conceptualization, Y.Y. and B.L.; methodology, Y.Y. and T.C.; software, Y.W.; validation, G.H., B.L. and Y.Y.; formal analysis, Y.W.; data curation, Y.Y., Y.H. and Y.Z.; writing—original draft preparation, Y.Y.; writing—review and editing, Y.Y., Y.W. and Y.H.; visualization, Y.Z. and T.C.; supervision, G.H. and B.L.; project administration, G.H. and B.L. All authors have read and agreed to the published version of the manuscript.

Funding

This research was funded by the National Natural Science Foundation of China (32101919).

Data Availability Statement

The data presented in this study are available on request from the corresponding author.

Conflicts of Interest

The authors declare no conflict of interest.

References

  1. Abdelhamid, A.G.; El-Dougdoug, N.K. Comparative genomics of the gut commensal Bifidobacterium bifidum reveals adaptation to carbohydrate utilization. Biochem. Biophys. Res. Commun. 2021, 547, 155–161. [Google Scholar] [CrossRef]
  2. Sharma, M.; Wasan, A.; Sharma, R.K. Recent developments in probiotics: An emphasis on Bifidobacterium. Food Biosci. 2021, 41, 100993. [Google Scholar] [CrossRef]
  3. Ventura, M.; O’Flaherty, S.; Claesson, M.J.; Turroni, F.; Klaenhammer, T.R.; Sinderen, D.V.; O’Toole, P.W. Genome-scale analyses of health-promoting bacteria: Probiogenomics. Nat. Rev. Microbiol. 2009, 7, 61–71. [Google Scholar] [CrossRef]
  4. Milani, C.; Turroni, F.; Duranti, S.; Lugli, G.A.; Mancabelli, L.; Ferrario, C.; van Sinderen, D.; Ventura, M. Genomics of the Genus Bifidobacterium Reveals Species-Specific Adaptation to the Glycan-Rich Gut Environment. Appl. Environ. Microbiol. 2015, 82, 980–991. [Google Scholar] [CrossRef] [PubMed]
  5. Ferrario, C.; Milani, C.; Mancabelli, L.; Lugli, G.A.; Duranti, S.; Mangifesta, M.; Viappiani, A.; Turroni, F.; Margolles, A.; Ruas-Madiedo, P.; et al. Modulation of the eps-ome transcription of bifidobacteria through simulation of human intestinal environment. FEMS Microbiol. Ecol. 2016, 92, fiw056. [Google Scholar] [CrossRef] [PubMed]
  6. Vurmaz, M.; Sahin, E.; Dertli, E. Potential Health Promoting Functions of Exopolysaccharides (EPS) from Lactic Acid Bacteria (LAB). In Proceedings of the 3rd International Conference on Advanced Engineering Technologies, Bayburt, Turkey, 19–21 September 2019; pp. 1379–1382. Available online: https://www.researchgate.net/publication/337027171 (accessed on 26 June 2023).
  7. Nguyen, P.T.; Nguyen, T.T.; Bui, D.C.; Hong, P.T.; Hoang, Q.-K.; Nguyen, H.-T. Exopolysaccharide production by lactic acid bacteria: The manipulation of environmental stresses for industrial applications. Aims Microbiol. 2020, 6, 451–469. [Google Scholar] [CrossRef]
  8. Zhou, Y.; Cui, Y.; Qu, X. Exopolysaccharides of lactic acid bacteria: Structure, bioactivity and associations: A review. Carbohydr. Polym. 2019, 207, 317–332. [Google Scholar] [CrossRef]
  9. Pizzino, G.; Irrera, N.; Cucinotta, M.; Pallio, G.; Mannino, F.; Arcoraci, V.; Squadrito, F.; Altavilla, D.; Bitto, A. Oxidative stress: Harms and benefits for human health. Oxid Med. Cell. Longev. 2017, 2017, 8416763. [Google Scholar] [CrossRef]
  10. Wang, X.; Shao, C.; Liu, L.; Guo, X.; Xu, Y.; Lü, X. Optimization, partial characterization and antioxidant activity of an exopolysaccharide from Lactobacillus plantarum KX041. Int. J. Biol. Macromol. 2017, 103, 1173–1184. [Google Scholar] [CrossRef]
  11. Inturri, R.; Molinaro, A.; Di Lorenzo, F.; Blandino, G.; Tomasello, B.; Hidalgo-Cantabrana, C.; De Castro, C.; Ruas-Madiedo, P. Chemical and biological properties of the novel exopolysaccharide produced by a probiotic strain of Bifidobacterium longum. Carbohydr. Polym. 2017, 174, 1172–1180. [Google Scholar] [CrossRef]
  12. Granato, D.; Branco, G.F.; Cruz, A.G.; Faria, J.D.A.F.; Shah, N.P. Probiotic dairy products as functional foods. Compr. Rev. Food Sci. Food Safe 2010, 9, 455–470. [Google Scholar] [CrossRef]
  13. Maryam, A.; Zaiton, H.; Mohamed, I.; Sharifah, N.R.S.A. Antioxidant activity of lactic acid bacteria (LAB) fermented skim milk as determined by 1,1-diphenyl-2-picrylhydrazyl (DPPH) and ferrous chelating activity (FCA). Afr. J. Microbiol. Res. 2012, 6, 6358–6364. [Google Scholar] [CrossRef]
  14. Liu, T.; Zhou, K.; Yin, S.; Liu, S.; Zhu, Y.; Yang, Y.; Wang, C. Purification and characterization of an exopolysaccharide produced by Lactobacillus plantarum HY isolated from home-made Sichuan Pickle. Int. J. Biol. Macromol. 2019, 134, 516–526. [Google Scholar] [CrossRef]
  15. DuBois, M.; Gilles, K.A.; Hamilton, J.K.; Rebers, P.A.; Smith, F. Colorimetric Method for Determination of Sugars and Related Substances. Anal. Chem. 1956, 28, 22–25. [Google Scholar] [CrossRef]
  16. Bradford, M.M. A rapid and sensitive method for quantitation of microgram quantities of protein utilizing the principle of protein-dye-binding. Anal. Biochem. 1976, 72, 248–254. [Google Scholar] [CrossRef]
  17. Blumenkrantz, N.; Asboe-Hansen, G. New method for quantitative determination of uronic acids. Anal. Biochem. 1973, 54, 484–489. [Google Scholar] [CrossRef] [PubMed]
  18. Chen, R.Z.; Meng, F.L.; Liu, Z.Q.; Chen, R.P.; Zhang, M. Antitumor activities of different fractions of polysaccharide purified from Ornithogalum caudatum Ait. Carbohydr. Polym. 2010, 80, 845–851. [Google Scholar] [CrossRef]
  19. Annadurai, V.; Ganesan, S.; Perumalsamy, B.; Krishnamurthy, M.; Arivalagan, P.; Yongkun, M.; Soundarapandian, S.; Ramasamy, T. Structural characterization, functional and biological activities of an exopolysaccharide produced by probiotic Bacillus licheniformis AG-06 from Indian polyherbal fermented traditional medicine. Int. J. Biol. Macromol. 2021, 174, 144–152. [Google Scholar] [CrossRef]
  20. Mao, Y.H.; Song, A.X.; Li, L.Q.; Yang, Y.; Yao, Z.P.; Wu, J.Y. A high-molecular weight exopolysaccharide from the Cs-HK1 fungus: Ultrasonic degradation, characterization and in vitro fecal fermentation. Carbohydr. Polym. 2020, 246, 116636. [Google Scholar] [CrossRef]
  21. Yang, X.; Ren, Y.; Zhang, L.; Wang, Z.; Li, L. Structural characteristics and antioxidant properties of exopolysaccharides isolated from soybean protein gel induced by lactic acid bacteria. LWT 2021, 150, 111811. [Google Scholar] [CrossRef]
  22. Li, W.; Xia, X.; Tang, W.; Ji, J.; Rui, X.; Chen, X.H.; Jiang, M.; Zhou, J.Z.; Zhang, Q.Q.; Dong, M.S. Structural Characterization and Anticancer Activity of Cell-Bound Exopolysaccharide from Lactobacillus helveticus MB2-1. J. Agric. Food Chem. 2015, 63, 3454–3463. [Google Scholar] [CrossRef]
  23. Wang, K.N.; Song, M.M.; Song, D.W.; Zhao, X.J.; Wu, J.; Lu, Y.; Niu, B.X.; Cai, G. Preparation, partial characterization and biological activity of exopolysaccharidesproduced from Lactobacillus fermentum S1. J. Biosci. Bioeng. 2020, 129, 206–214. [Google Scholar] [CrossRef]
  24. Du, R.; Qiao, X.; Zhao, F.; Song, Q.; Zhou, Q.; Wang, Y.; Pan, L.; Han, Y.; Zhou, Z. Purification, characterization and antioxidant activity of dextran produced by Leuconostoc pseudomesenteroides from homemade wine. Carbohydr. Polym. 2019, 198, 529–536. [Google Scholar] [CrossRef]
  25. Ma, X.; Pan, Y.; Zhao, W.; Sun, P.; Zhao, J.; Yan, S.; Wang, R.; Han, Y.; Liu, W.; Tan, S.; et al. Bifidobacterium infantis strain YLGB-1496 possesses excellent antioxidant and skin barrier-enhancing efficacy in vitro. Exp. Dermatol. 2022, 31, 1089–1094. [Google Scholar] [CrossRef] [PubMed]
  26. Zhao, L.; Wang, S.; Dong, J.; Shi, J.; Guan, J.; Liu, D.Y.; Liu, F.; Li, B.L.; Huo, G.C. Identification, Characterization, and Antioxidant Potential of Bifidobacterium longum subsp. longum Strains Isolated From Feces of Healthy Infants. Front. Microbiol. 2021, 12, 756519. [Google Scholar] [CrossRef] [PubMed]
  27. Jolly, L.; Stingele, F. Molecular organization and functionality of exopolysaccharide gene clusters in lactic acid bacteria. Int. Dairy J. 2001, 11, 733–745. [Google Scholar] [CrossRef]
  28. Li, M.; Li, W.; Li, D.; Tian, J.; Xiao, L.; Kwok, L.Y.; Li, W.; Sun, Z. Structure characterization, antioxidant capacity, rheological characteristics and expression of biosynthetic genes of exopolysaccharides produced by Lactococcus lactis subsp. lactis IMAU11823. Food Chem. 2022, 384, 132566. [Google Scholar] [CrossRef] [PubMed]
  29. Li, S.; Huang, R.; Shah, N.P.; Tao, X.; Xiong, Y.; Wei, H. Antioxidant and antibacterial activities of exopolysaccharides from Bifidobacterium bifidum WBIN03 and Lactobacillus plantarum R315. J. Dairy Sci. 2014, 97, 7334–7343. [Google Scholar] [CrossRef]
  30. Hu, S.M.; Zhou, J.M.; Zhou, Q.Q.; Li, P.; Xie, Y.Y.; Zhou, T.; Gu, Q. Purification, characterization and biological activities of exopolysaccharides from Lactobacillus rhamnosus ZFM231 isolated from milk. LWT 2021, 147, 111561. [Google Scholar] [CrossRef]
  31. Ge, Z.W.; Bao, X.; Li, Z.Y.; Chen, X.H.; Li, W.; Rui, X.; Wu, J.J.; Zhang, Q.Q.; Dong, M.S. In situ exopolysaccharides produced by Lactobacillus helveticus MB2-1 and its effect on gel properties of Sayram ketteki yoghurt. Int. J. Biol. Macromol. 2022, 208, 314–323. [Google Scholar] [CrossRef]
  32. Wang, Y.; Liu, G.; Liu, R.; Wei, M.; Sun, C. EPS364, a Novel Deep-Sea Bacterial Exopolysaccharide, Inhibits Liver Cancer Cell Growth and Adhesion. J. Appl. Phycol. 2021, 33, 2983–2994. [Google Scholar] [CrossRef]
  33. Tukenmez, U.; Aktas, B.; Aslim, B.; Yavuz, S. The relationship between the structural characteristics of lactobacilli-EPS and its ability to induce apoptosis in colon cancer cells in vitro. Sci. Rep. 2019, 9, 8268. [Google Scholar] [CrossRef] [PubMed]
  34. Lynch, K.M.; Zannini, E.; Coffey, A.; Arendt, E.K. Lactic Acid Bacteria Exopolysaccharides in Foods and Beverages: Isolation, Properties, Characterization, and Health Benefits. Annu. Rev. Food Sci. Technol. 2018, 9, 155–176. [Google Scholar] [CrossRef]
  35. Peng, Y.; Zhang, L.; Zeng, F.; Kennedy, J.F. Structure and antitumor activities of the water-soluble polysaccharides from Ganoderma tsugae mycelium. Carbohydr. Polym. 2005, 59, 385–392. [Google Scholar] [CrossRef]
  36. Sasikumar, K.; Vaikkath, D.K.; Devendra, L.; Nampoothiri, K.M. An exopolysaccharide (EPS) from a Lactobacillus plantarum BR2 with potential benefits for making functional foods. Bioresour. Technol. 2017, 241, 1152–1156. [Google Scholar] [CrossRef]
  37. Wang, J.; Zhao, X.; Tian, Z.; Yang, Y.; Yang, Z. Characterization of an exopolysaccharide produced by Lactobacillus plantarum YW11 isolated from Tibet Kefir. Carbohydr. Polym. 2015, 125, 16–25. [Google Scholar] [CrossRef] [PubMed]
  38. Amiri, S.; Mokarram, R.R.; Khiabani, M.S.; Bari, M.R.; Khaledabad, M.A. Exopolysaccharides production by Lactobacillus acidophilus LA5 and Bifidobacterium animalis subsp. lactis BB12: Optimization of fermentation variables and characterization of structure and bioactivities. Int. J. Biol. Macromol. 2019, 123, 752–765. [Google Scholar] [CrossRef]
  39. Ayyash, M.; Abu-Jdayil, B.; Itsaranuwat, P.; Almazrouei, N.; Galiwango, E.; Esposito, G.; Hunashal, Y.; Hamed, F.; Najjar, Z. Exopolysaccharide produced by the potential probiotic Lactococcus garvieae C47: Structural characteristics, rheological properties, bioactivities and impact on fermented camel milk. Food Chem. 2020, 333, 127418. [Google Scholar] [CrossRef]
  40. Di, W.; Zhang, L.; Wang, S.; Yi, H.; Han, X.; Fan, R.; Zhang, Y. Physicochemical characterization and antitumour activity of exopolysaccharides produced by Lactobacillus casei SB27 from yak milk. Carbohydr. Polym. 2017, 171, 307–315. [Google Scholar] [CrossRef]
  41. Rajoka, M.S.R.; Mehwish, M.H.; Fang, H.; Padhiar, A.A.; Zeng, X.; Khurshid, M.; He, Z.D.; Zhao, L.Q. Characterization and anti-tumor activity of exopolysaccharide produced by Lactobacillus kefiri isolated from Chinese kefir grains. J. Funct. Foods 2019, 63, 103588. [Google Scholar] [CrossRef]
  42. Chen, Z.; Shi, J.; Yang, X.; Nan, B.; Liu, Y.; Wang, Z. Chemical and physical characteristics and antioxidant activities of the exopolysaccharide produced by Tibetan kefir grains during milk fermentation. Int. Dairy J. 2015, 43, 15–21. [Google Scholar] [CrossRef]
  43. Xing, H.; Du, R.; Zhao, F.; Han, Y.; Xiao, H.; Zhou, Z. Optimization, chain conformation and characterization of exopolysaccharide isolated from Leuconostoc mesenteroides DRP105. Int. J. Biol. Macromol. 2018, 112, 1208–1216. [Google Scholar] [CrossRef] [PubMed]
  44. Xu, Z.; Li, X.; Tian, X.; Yang, S.; Li, Y.; Li, Z.G.; Guo, T.T.; Kong, J. Characterization of the antioxidant activities of the exopolysaccharides produced by Streptococcus thermophilus CGMCC 7.179. LWT 2023, 173, 114256. [Google Scholar] [CrossRef]
  45. Xu, R.H.; Shang, N.; Li, P.L. In vitro and in vivo antioxidant activity of exopolysaccharide fractions from Bifidobacterium animalis RH. Anaerobe 2011, 17, 226–231. [Google Scholar] [CrossRef]
  46. Liu, L.; Xu, J.; Du, R.; Ping, W.; Ge, J.; Zhao, D. The response surface optimization of exopolysaccharide produced by Saccharomyces cerevisiae Y3 and its partial characterization. Prep. Biochem. Biotechnol. 2021, 52, 566–577. [Google Scholar] [CrossRef]
  47. Jiang, C.; Xiong, Q.; Gan, D.; Jiao, Y.P.; Liu, J.; Ma, L.P.; Zeng, X.X. Antioxidant activity and potential hepatoprotective effect of polysaccharides from Cyclina sinensis. Carbohydr. Polym. 2013, 91, 262–268. [Google Scholar] [CrossRef]
  48. Wang, J.; Zhao, X.; Yang, Y.; Zhao, A.M.; Yang, Z.N. Characterization and bioactivities of an exopolysaccharide produced by Lactobacillus plantarum YW32. Int. J. Biol. Macromol. 2014, 74, 119–126. [Google Scholar] [CrossRef]
  49. Choudhuri, I.; Khanra, K.; Maity, P.; Patra, A.; Maity, G.N.; Pati, B.R.; Nag, A.; Mondal, S.; Bhattacharyya, N. Structure and biological properties of exopolysaccharide isolated from Citrobacter freundii. Int. J. Biol. Macromol. 2021, 168, 537–549. [Google Scholar] [CrossRef]
  50. Zheng, J.Q.; Mao, X.J.; Geng, L.J.; Yang, G.M.; Xu, C.P. Production optimization, preliminary characterization and bioactivity of exopolysaccharides from Incutis tamaricis (Pat.) Fiasson & Niemela. J. Taiwan Inst. Chem. Eng. 2014, 45, 725–733. [Google Scholar] [CrossRef]
  51. Xiang, Y.L.; Xu, X.Q.; Li, J. Chemical properties and antioxidant activity of exopolysaccharides fractions from mycelial culture of Inonotus obliquus in a ground corn stover medium. Food Chem. 2012, 134, 1899–1905. [Google Scholar] [CrossRef]
  52. Xu, R.B.; Yang, X.; Wang, J.; Zhao, H.T.; Lu, W.H.; Cui, J.; Cheng, C.L.; Zou, P.; Huang, W.W.; Wang, P.; et al. Chemical composition and antioxidant activities of three polysaccharide fractions from pine cones. Int. J. Mol. Sci. 2012, 13, 14262–14277. [Google Scholar] [CrossRef] [PubMed]
Figure 1. Antioxidant capacities of IC, CFE, and CFS. Values with different superscript letters (a, b, and c) significantly differed at p < 0.05 in the same group.
Foods 12 02988 g001
Figure 2. Circular genome map of B. bifidum E3 (A) COG functional classification of the B. bifidum E3 genome (B) KEGG pathway classification of the E3 genome (C) From the outer circle to the inner circle, the first circle and the second circle represent genes on the positive and negative strands, including CDS, tRNA, rRNA, and other genes; the third circle represents GC content; the fourth circle represents GC skew; where green means GC > 0, and purple means GC < 0, the junction of green and purple is the start point and end point of replication, respectively.
Foods 12 02988 g002
Figure 3. Synthesis of sugar nucleotides (A) and gene clusters (B) of B. bifidum E3.
Foods 12 02988 g003
Figure 4. Antioxidant capacities of cEPS. Values with different superscript letters (a, b, c and d) significantly differed at p < 0.05 in the same group.
Foods 12 02988 g004
Figure 5. Ultraviolet spectroscopy (A) and FT-IR spectroscopy (B) of EPS-1, EPS-2, and EPS-3; Field emission scanning electron microscopes of EPS-1 (C), EPS-2 (D), and EPS-3 (E) at magnifications of 5000× and 10,000×; Congo red determination of EPS-1, EPS-2, and EPS-3 (F).
Foods 12 02988 g005
Figure 6. Scavenging capacities of EPS-1, EPS-2, and EPS-3 on DPPH radicals (A), hydroxyl radicals (B), and superoxide anion radicals (C). Values with different superscript letters (a, b, c and d) significantly differed at p < 0.05 in the same group.
Foods 12 02988 g006
Figure 7. Correlation between chemical composition and antioxidant capacities.
Foods 12 02988 g007
Table 1. Sugar transport system of B. bifidum E3.
SpecificityLocus_TagProduct
GlucoseE3_00280PTS system glucose-specific EIIA component
N-acetylglucosamineE3_00281PTS N-acetylglucosamine transporter subunit IIABC
GalactoseE3_01493Galactose permease
FructoseE3_01538PTS system, fructose/glucose-specific IIABC
FucoseE3_00598Fucose permease
LactoseE3_01046Lactose permease
Lactose transport system permease protein LacF
E3_01493
SugarE3_01045multiple-sugar transport system permease protein
E3_01046ABC-type sugar transport system, permease component
E3_01047, E3_01393multiple-sugar transport system substrate-binding protein
E3_01751PTS sugar transporter subunit IIB
Table 2. Chemical compositions, monosaccharide compositions, and molecular weights of EPS-1, EPS-2, and EPS-3.
SampleEPS-1EPS-2EPS-3
Yield (%)29.33%23.00%10.67%
Neutral sugar (%)90.53 ± 0.52 a89.16 ± 1.34 a72.47 ± 2.81 b
Protein (%)0.25 ± 0.09 b 1.04 ± 0.10 b2.61 ± 0.63 a
Uronic acid (%)0.24 ± 0.08 c0.49 ± 0.06 b0.94 ± 0.07 a
Sulphate (%)1.65 ± 0.31 b2.26 ± 0.34 a2.33 ± 0.11 a
Molecular weight (Da)4.15 × 10⁴ 3.67 × 10⁴ 5.89 × 10⁴
Molar ratioMan: Glu = 1:5.04Rha: Man: Glu = 0.32: 1: 1.56Rha: Man: GlcN: Gal:
glu: GluA = 1.10: 1: 0.82: 1.05: 1.39: 0.68
a–c Different letters in the same line indicated significant differences (p < 0.05).
Disclaimer/Publisher’s Note: The statements, opinions and data contained in all publications are solely those of the individual author(s) and contributor(s) and not of MDPI and/or the editor(s). MDPI and/or the editor(s) disclaim responsibility for any injury to people or property resulting from any ideas, methods, instructions or products referred to in the content.

