Next Article in Journal
Effects of Graphene Oxide on the Properties of Engineered Cementitious Composites: Multi-Objective Optimization Technique Using RSM
Previous Article in Journal
A Comparative Study on the Stability Performance of the Suspen-Dome, Conventional Cable Dome, and Ridge-Beam Cable Dome
 
 
Order Article Reprints
Article

Mechanical and Microstructural Properties of Rubberized Geopolymer Concrete: Modeling and Optimization

1
Civil and Environmental Engineering Department, Universiti Teknologi PETRONAS, Bandar Seri Iskandar 32610, Malaysia
2
Institute of Energy Infrastructure, Universiti Tenaga Nasional, Putrajaya Campus, Jalan Kajang-Puchong, Kajang 43000, Malaysia
3
Department of Civil Engineering, Amity School of Engineering & Technology, Amity University Uttar Pradesh, Noida 201303, India
4
Civil Department, SR University, Warangal 506371, India
*
Author to whom correspondence should be addressed.
Buildings 2023, 13(8), 2021; https://doi.org/10.3390/buildings13082021 (registering DOI)
Received: 31 May 2023 / Revised: 26 June 2023 / Accepted: 4 July 2023 / Published: 8 August 2023
(This article belongs to the Section Building Materials, and Repair & Renovation)

Abstract

:
The construction industry is increasingly focused on sustainability, with a particular emphasis on reducing the environmental impact of cement production. One approach to this problem is to use recycled materials and explore eco-friendly raw materials, such as alumino-silicate by-products like fly ash, which can be used as raw materials for geopolymer concrete. To enhance the ductility, failure mode, and toughness of the geopolymer, researchers have added crumb rubber processed from scrap tires as partial replacement to fine aggregate of the geopolymer. Therefore, this study aims to develop rubberized geopolymer concrete (RGC) by partially replacing the fine aggregate with crumb rubber (CR). To optimize the mechanical properties of RGC, response surface methodology (RSM) has been used to develop 13 mixes with different levels and proportions of CR (10–30% partial replacement of fine aggregate by volume) and sodium hydroxide molarity (10–14 M) as input variables. The results showed that the strength properties increased as the molarity of NaOH increased, while the opposite trend was observed with CR. The maximum values for compressive strength, flexural strength, and uniaxial tensile strength were found to be 25 MPa, 3.1 MPa, and 0.41 MPa, respectively. Response surface models of the mechanical strengths, which were validated using ANOVA with high R2 values of 72–99%, have been developed. It has been found that using 10% CR with 14 M sodium hydroxide resulting in the best mechanical properties for RGC, which was validated with experimental tests. The result of the multi-objective optimization indicated that the optimum addition level for NaOH is 14 M, and the fine aggregate replacement level with CR is 10% in order to achieve a rubberized geopolymer suitable for structural applications.

1. Introduction

Ordinary Portland cement (OPC) is extensively utilized as a building material globally and is a major source of CO2 emissions. The cement industry accounts for approximately 7% of the total CO2 emissions worldwide, making it one of the largest anthropogenic greenhouse gas sources [1]. The production of OPC has been identified as a significant contributor to CO2 emissions since it requires high-temperature kilns to heat the raw materials, such as limestone, clay, and shale to a temperature of around 1450 °C [2]. This process emits approximately 50% of CO2 emissions due to the decomposition of limestone, with 40% arising from the combustion of fossil fuels, and 10% originating from transportation and electricity usage [3].
There are several alternatives to Ordinary Portland cement (OPC) that are being developed and used in the construction industry. Some of the most promising alternatives, include Portland limestone cement, Portland pozzolana cement, geopolymer concrete, calcium sulfoaluminate cement and magnesium oxide cement. These alternatives have shown potential in reducing the environmental impact of cement production, and their adoption can contribute to the transition towards a more sustainable and low-carbon construction industry [4,5].
Geopolymer concrete is a type of concrete that is made using industrial waste materials such as fly ash, ground granulated blast furnace slag, silica fume, and metakaolin, in combination with alkaline activators. Unlike traditional Portland cement-based concrete, geopolymer concrete does not require the use of limestone or high-temperature kilns, resulting in significantly lower carbon emissions [6]. The geopolymerization process involves a rapid chemical reaction in an alkaline environment, which leads to the formation of a three-dimensional polymer structure and a ring framework made up of Si-O-Al-O bonds [7]. Geopolymer concrete has superior performance compared to traditional Portland cement-based concrete, with advantages including reduced carbon footprint, improved durability, less creep and shrinkage, better fire resistance, and higher strength [5,6,7,8].
To address the limitations of OPC concrete, researchers have explored the option of replacing traditional aggregate with crumb rubber (CR) obtained from discarded tires. Concrete properties, such as durability, elasticity, and impact resistance, have been shown to benefit from the addition of crumb rubber, according to well-documented research [9,10,11,12,13,14,15]. This can result in more robust concrete structures that require less maintenance and have a longer lifespan. CR is created by shredding or grinding discarded tires into small, consistent pieces. Its characteristics are influenced by various factors such as particle size, shape, tire type, and processing technique. The size of CR particles can vary from small granules to large chunks, and the shape of particles depends on the processing method, with ambient grinding generating irregularly shaped particles and cryogenic grinding producing more uniform and spherical particles [12,13,14,15].
Addition of admixtures and other compounds in concrete is researched widely. Waste tire recycling for cementitious applications has been studied for decades, but the compatibility of rubber with alkali-activated cements has received less attention. The United States faces an environmental problem due to the disposal of the approximately 300 million end-of-life tires produced yearly [16,17]. Research by Guo et al. [18] suggests that using scrap tires as an additive to concrete can increase the material’s fracture toughness and ductility while decreasing its permeability. Compared to traditional aggregates, crumb rubber is typically softer, and its excellent elasticity helps absorb shock, minimizing noise and vibrations. Additionally, it is highly durable and can withstand wear and tear while also exhibiting high resistance to chemicals like acids and solvents.
Similar to conventional OPC concrete, geopolymer concrete has lower tensile strength, flexibility, and elasticity, and is less resistant to cracking, despite its numerous advantages [19,20,21,22,23,24]. With this in mind, researchers have sought to replace fine aggregate with crumb rubber in geopolymer concrete as a means of addressing its shortcomings, which include brittleness, limited impact resistance, and high density, and improving its physical attributes, such as thermal conductivity and acoustic properties. In a study conducted by Wongsa et al. [19], the properties of geopolymer incorporating 100% crumb rubber (CRGM) as a substitute for fine aggregate were investigated. The findings indicated a noteworthy reduction in both density and thermal conductivity in the CRGM. Additionally, a considerable decrease in compressive and flexural strength was observed, although the failure mode shifted to a ductile behavior. The study also noted an increase in porosity and water absorption [19].
Similarly, according to the findings of a research study conducted by Azmi et al. [20], crumb rubber can be easily incorporated into geopolymer concrete. However, the inclusion of crumb rubber has a negative impact on strength. Specifically, when 15% crumb rubber is added to the mixture, the compressive strength of rubberized geopolymer concrete decreases by approximately 60%. Additionally, the rate of increase in compressive strength for higher amounts of crumb rubber is lower compared to that of ordinary concrete. Despite this reduction in compressive strength, geopolymer concrete with crumb rubber remains suitable for a variety of engineering applications [20]. Metwally et al. [23] have reported similar findings, indicating that the incorporation of CR into geopolymer or fibrous rubberized geopolymer results in a notable enhancement in ductility, failure mode, and toughness. Nevertheless, the resulting mechanical properties are generally inferior to those of the control geopolymer [23].
In a study conducted by Mohammed et al. [22], the feasibility of incorporating CR into geopolymer interlocking bricks was investigated. The test findings indicated that the resulting bricks had lower compressive and flexural strengths than conventional bricks, and their water absorption capacity was higher. Nevertheless, despite these drawbacks, the bricks were designated as non-effloresced and assigned a third-class rating, implying that they can be utilized as non-load bearing material. According to Luhar and Luhar [21], incorporating crumb rubber into concrete enhances its ductility and impact resistance, albeit at the cost of reduced compressive, tensile, and flexural strengths. Nevertheless, it was recommended that further investigation is necessary to validate crumb rubber as a feasible substitute for natural aggregates in geopolymer concrete, as there is inadequate data on its mechanical characteristics [21].
In a recent study by Abdulaziz et al. [24], rubberized geopolymer concrete was examined, and the outcomes demonstrated that the sustainable concrete blends had favorable mechanical and durability properties in both fresh and hardened states. Xiao et al. [25] also reported the effect of CR oxidation using NaOH treatment on the mechanical and durability properties of geopolymer and cementitious composites. The results indicated CR functioned as an electrical insulator and played a role in enhancing the hydrophobic characteristics of the pore walls. Furthermore, the NaOH pretreatment resulted in surface oxidation of the rubber particles, leading to the generation of a higher number of polar groups. The inclusion of CR content resulted in a decrease in sulfate expansion due to the demobilization of sulfate and the alleviation of internal stress.
These findings indicate that the geopolymer rubberized concrete has the potential for diverse applications in the construction sector, particularly in instances where the emphasis is on decreasing self-weight and boosting flexibility [24]. The study by Pham et al. [26] also reiterated the potential of using rubberized geopolymer for lightweight structural applications because of its high energy absorption ability. Similar conclusions were drawn by Aslani et al. [27].
Through this literature review, it is very evident that despite some available studies on RGP, the mechanism of interaction between added rubber and geopolymer is not studied widely, and the strength increase with various sizes of rubber is also not studied. Keeping this in mind, this work is designed with the main aim of employing response surface methodology (RSM) as a novel way to investigate, model, and optimize the influence of different ratios of crumb rubber on the mechanical properties of geopolymer concrete. Despite the increasing interest in this eco-friendly construction material, there is a lack of comprehensive research exploring the complex relationships between variables and their impact on concrete properties. By utilizing RSM, this study aims to bridge this gap by systematically investigating the factors influencing rubberized geopolymer concrete and optimizing its mix design for enhanced performance and sustainability. RSM is of great significance in addressing the existing gap in the literature regarding the development and optimization of rubberized geopolymer concrete mixes.

2. Materials & Methods

2.1. Materials

The main ingredients of rubberized geopolymer concrete are geopolymer paste, fine aggregates, and crumb rubbers. In this study, fly ash (FA) was utilized as the aluminosilicate precursor. As shown in Figure 1a, FA is a fine powder generated as a byproduct of coal combustion, and it has proven to be a promising precursor for synthesizing various materials due to its abundance, low cost, and unique properties. The FA falls under class F as categorized by ASTM 618 due to its high content of SiO2, Fe2O3, and Al2O3, which constitutes 86.87% of its total composition as contained in Table 1. The river sand as fine aggregate with particles size range between 0.3 mm and 2.36 mm has been used. Crumb rubber Is produced from scrap tires through a multi-step process that involves shredding, steel removal, granulation, cleaning, drying, sieving, and packaging. Tires are first collected, shredded, and the steel wires are removed. The shredded rubber is then granulated into small, uniform-sized granules, which are washed, dried, and sieved into different sizes before being packaged as crumb rubber. In this case, crumb rubber with maximum grain size of 5 mm as shown in Figure 1b as used as partial replacement to fine aggregate by volume. The physical properties of fine aggregate and crumb rubber are shown in Table 2.
The most common soluble alkaline activator used in the production of geopolymer is sodium hydroxide (NaOH), which is then coupled with sodium silicate. For the geopolymerization process, sodium silicate (Na2SiO3) is employed as an alkaline activator. Na2SiO3 is a key component in geopolymerization technique. In this experiment sodium silicate that had 2:1 ratio of SiO2 to Na2O in its composition is utilized. This equates to 14.7% sodium oxide, 29.4% silicon dioxide, and 55.9% water. Alkaline activator is a combination of sodium hydroxide and sodium silicate, and when NaOH is included in the activating solution, the reaction happens more quickly, and the gel is less smooth. The design of the mixture was determined to be 10 M to 14 M for NaOH and 10 percent to 30 percent for the proportion of crumb rubber replacement. These ranges were arrived at based on the most common optimum ranges considered in the literature.

2.2. RSM Mix Design and Specimen Preparation

The RSM-generated mixes and quantities of materials used are presented in Table 3. The Geopolymer concrete mix proportions were formulated using Response Surface Methodology (RSM). The RSM generated thirteen different mixes using the sodium hydroxide (NaOH) alkaline activator at molarity values of 10, 12, and 14 M, and CR replacement of fine aggregate by volume of 10, 20, and 30%. As shown in Table 3, the mixes contain five repetitions of the central points (12 M and 20%) based on the RSM’s central composite design (CCD) configuration. The replicated central points are used to estimate the pure error in the lack of fit test. The mixes were produced in the lab, and the responses of interest (compressive strength, modulus of rupture, and direct tensile strength) were evaluated.
For rubberized geopolymer concrete mixtures, fine aggregates and rubber crumbs were mixed for 30 s to 1 min until the mixture became homogenous. Subsequently, an alkaline activator solution, which contained sodium hydroxide and sodium silicate, was added and then stirred for 3 min until the mixture was completely homogenous. The mixture was then poured into the moulds. Any trapped air or voids were removed by layering the mixture twice, with each layer tamped 20 times using a tamping rod. The cast specimens were then left to cure at the ambient temperature of about 25 °C for 24 h to harden. Prior to testing, geopolymer concrete specimens were cured for 24 h at 60 °C and subsequently for 28 days at 25 °C. The details of the tests performed on the concrete are explained in the next sections.

2.3. Experimental Tests

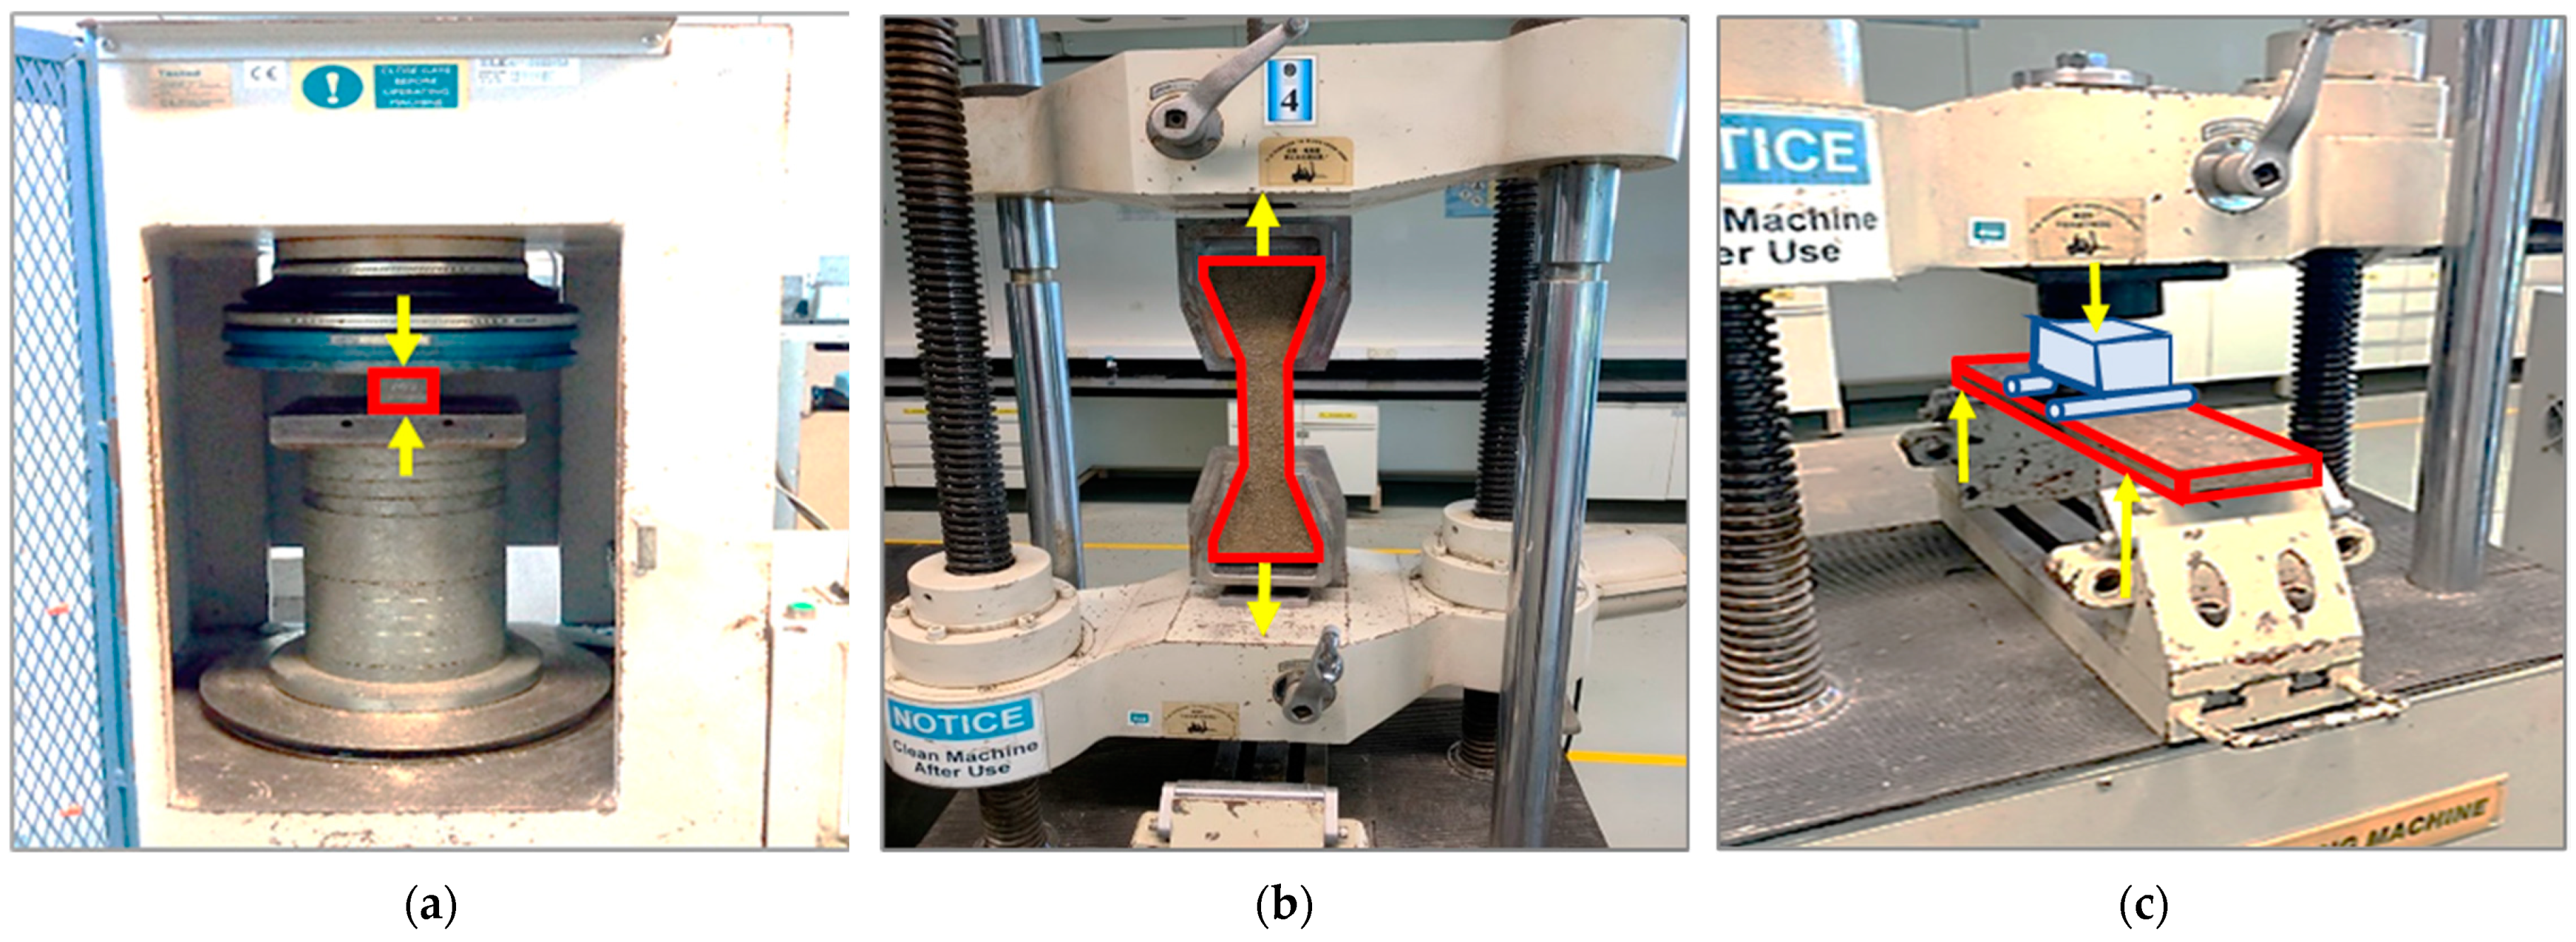
2.3.1. Compressive Strength Test

Six 50 mm RGC cubes were produced, subjected to the curing process, and tested in compliance with the specifications outlined in BS EN 12390-3: 2019 [28]. The compressive strength test (the test setup shown in Figure 2a) was carried out at two different curing ages, specifically 14 and 28 days, at a loading rate of 0.15 MPa/s. The average of the three results for each curing period was recorded as the compressive strength of the RGC mix.

2.3.2. Direct Tensile Strength

The direct tensile test utilized a dog bone-shaped sample with dimensions of 50 mm × 130 mm × 420 mm. The purpose of this test was to evaluate the direct tensile strength of specified RGC according to the standards set by the Japan Society of Civil Engineers. The process involved shaping custom-made RGC briquettes into the required dog bone shape, which were then subjected to a tensile force in a Universal Testing Machine (UTM) equipped with a 200 kN load capacity. The force required to split a sample in half was measured, and the average of the three results was used to calculate the RGC direct tensile strength.
Three samples of each RGC mix were tested after being cured for 28 days. The testing was performed at a loading rate of 0.15 mm/s. The average of three test results was then reported as the tensile strength of the cementitious composite mix after 28 days of curing. The test setup is shown in Figure 2b.

2.3.3. Flexural Tensile Strength

A beam sample measuring 500 mm × 100 mm × 100 mm was utilized in a flexural test. The objective of this test was to determine the flexural strength of the sample using the four-point loading technique specified by ASTM C78/C78M. After 28 days of curing, the flexural test was conducted using a universal testing equipment that had a force capacity of 200 kN and equipped with data logging and a computer display for precise evaluation. Figure 2c illustrates the setup employed for the flexural test. The sample was subjected to a constant loading rate of 0.051 mm/s until it fractured.

2.4. Field-Emission Scanning Electron Microscopy (FESEM)

Selected samples from the mixtures were subjected to FESEM analysis in order to obtain insight into the effect of the pre-treatment at the micro and nanoscale levels and to better comprehend the interaction between the CR and the hardened matrix. The purpose of the investigation is to collect data on the interfacial transition zone (ITZ) between the CR and the geopolymer paste matrix.

3. Results and Discussion

3.1. Mechanical Properties of RGC

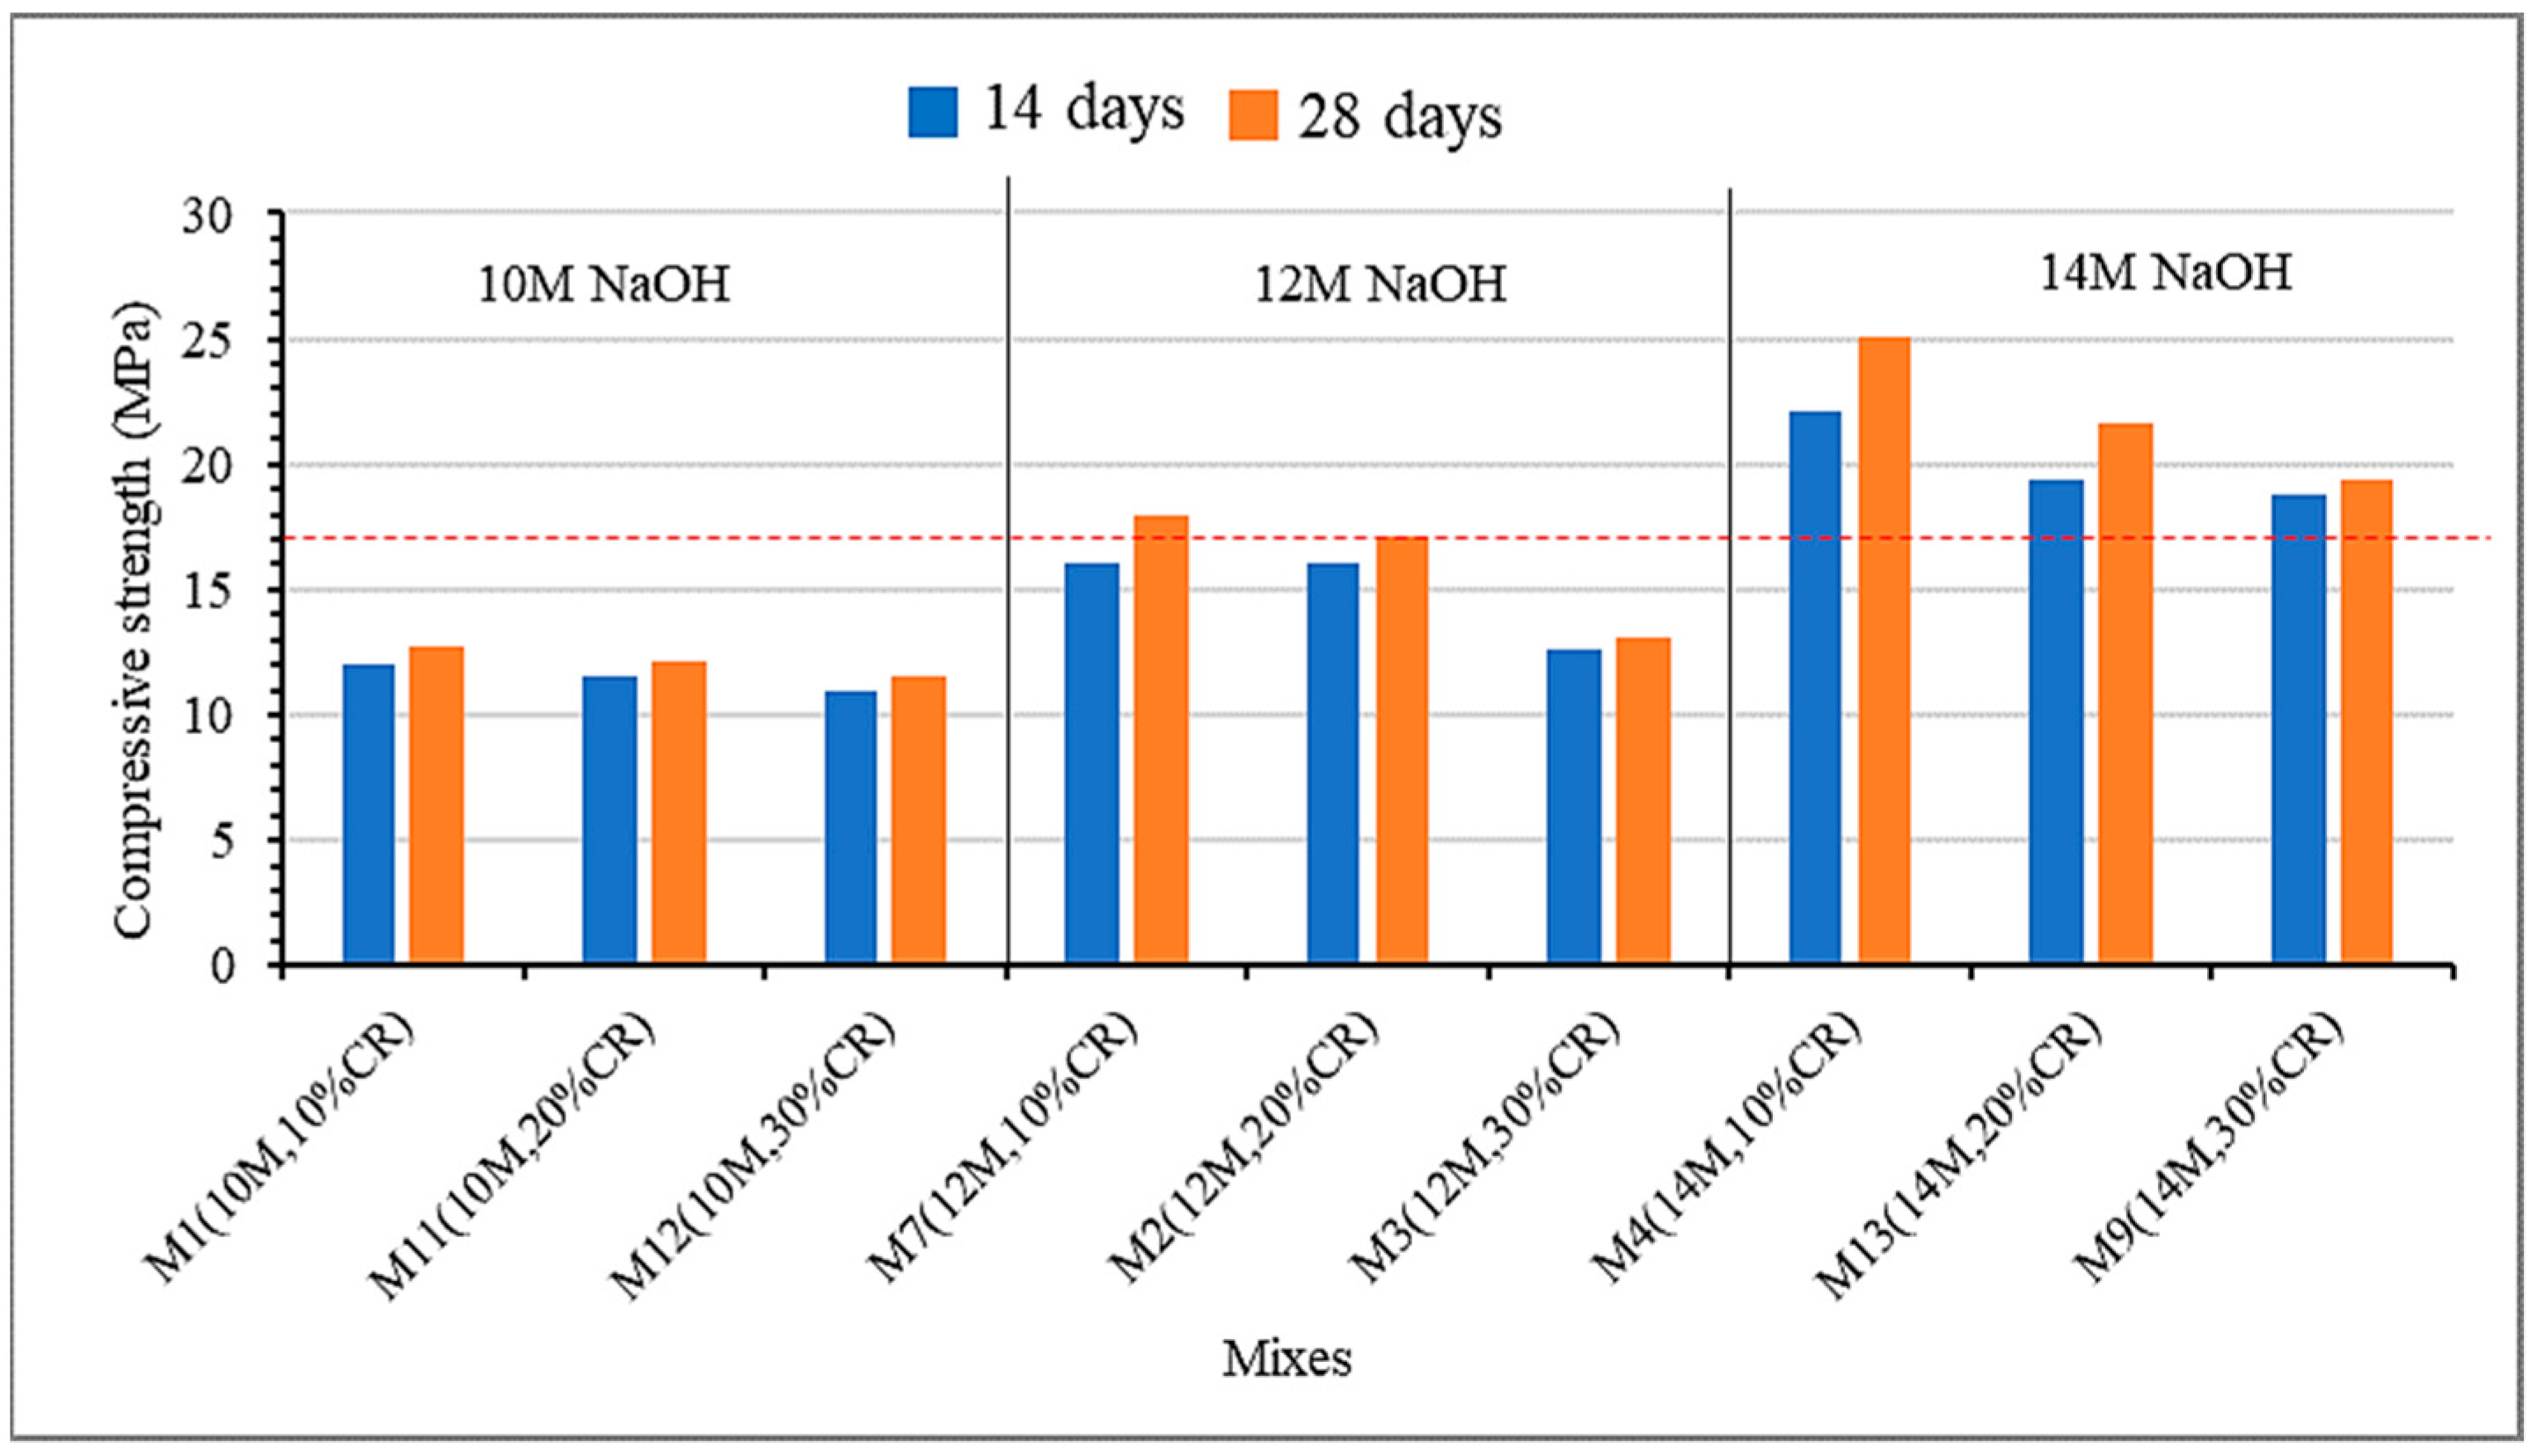
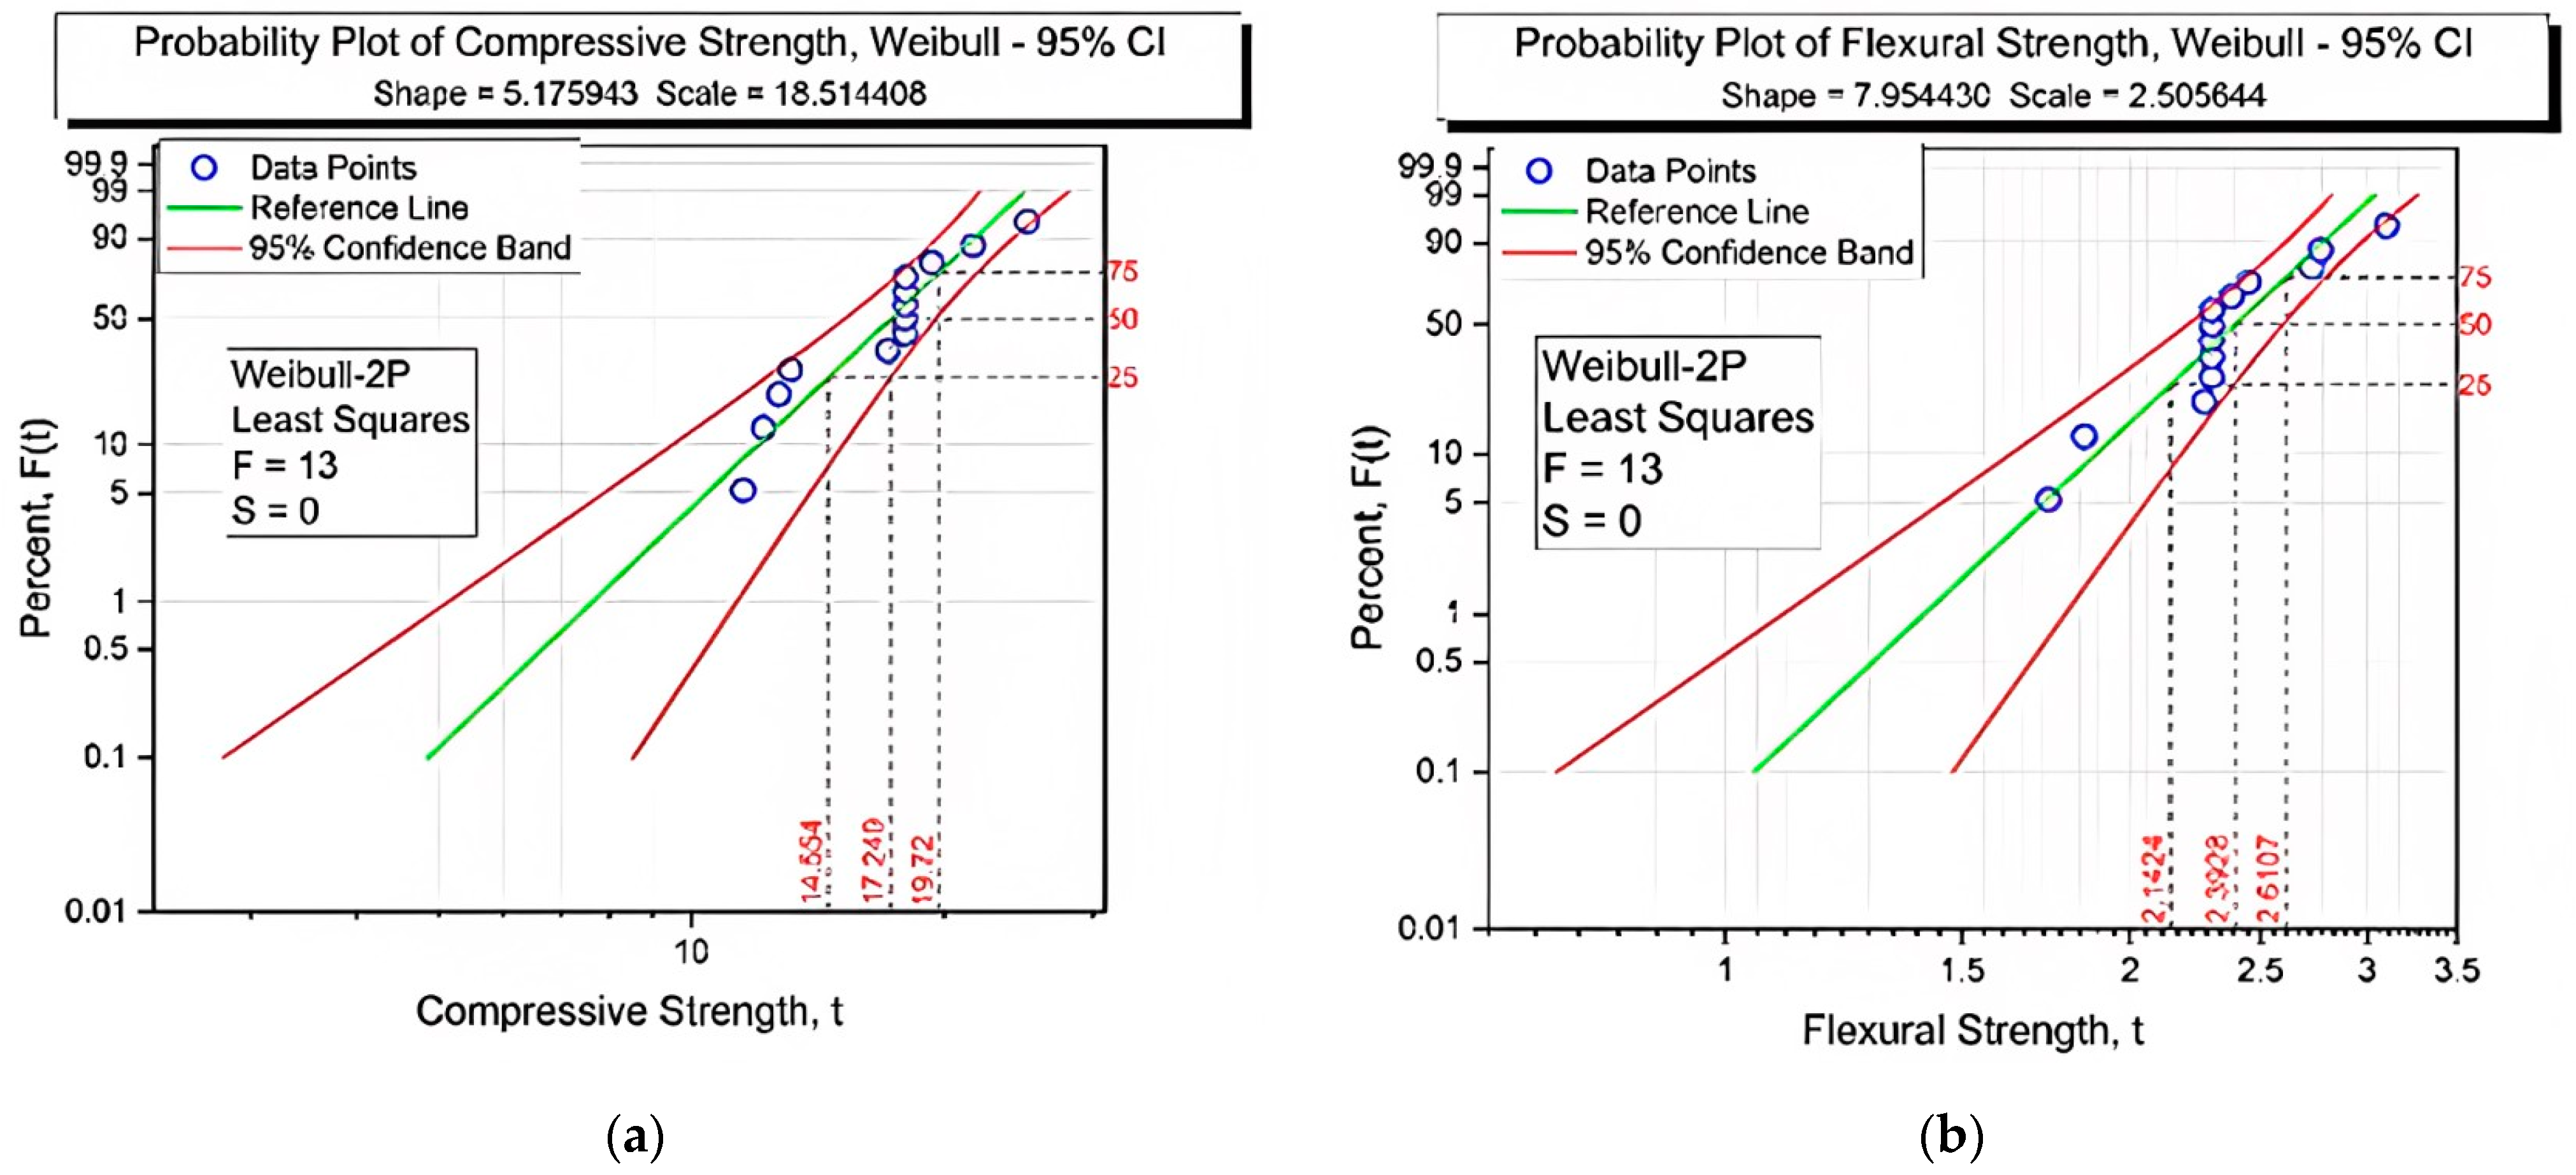
3.1.1. Compressive Strength of RGC

Figure 3 presents the results of the compressive strength test conducted on the samples at 14 and 28 days of curing. The findings indicate a general increase in the compressive strength of the RGC as the NaOH molarity increased. The maximum strength was achieved on the 28th day, with M4 exhibiting the highest compressive strength of 25 MPa, attributed to its 10% crumb rubber content and 14 M sodium hydroxide. Conversely, M12 with 30% crumb rubber and 10 M of sodium hydroxide displayed the lowest compressive strength of 11.5 MPa. These results are within the range of compressive strength results of RGC reported in the literature. Compressive strength was observed to be higher in mixtures with a higher NaOH molarity. This is in line with the findings of Chowdhury et al. [29] that NaOH increases the reactivity of aluminosilicate materials, facilitating the dissolution and subsequent polymerization reactions. This leads to the formation of a more extensive geopolymer network, resulting in improved strength. This can be attributed to the enhanced geopolymerization reaction facilitated by the increased availability of hydroxyl ions at higher NaOH molarities. As a result, more geopolymeric bonds are formed, leading to a denser microstructure and an increase in compressive strength and other mechanical properties of rubberized geopolymer concrete (RGC). Overall, NaOH functions are a key activator in geopolymer concrete, facilitating the processes of gel formation, polymerization, and dissolution. These procedures lead to the creation of a strong material with acceptable mechanical characteristics.
Overall, the findings suggest that increasing the replacement level of crumb rubber results in a decrease in compressive strength. When comparing mixes with varying amounts of CR but the same NaOH molarity, those with higher CR replacement exhibited lower compressive strength. This reduction can be attributed to the presence of voids and weak bond formations between crumb rubber and the geopolymer matrix, leading to a decrease in the density and strength of RGC. Insufficient bonding and weaker interfacial bonding between the binder and aggregates contribute to the decrease in compressive strength observed with higher crumb rubber content. Additionally, the introduction of 30% crumb rubber leads to capillary porosity that erodes the strength, further lowering the concrete’s compressive strength. The less dense and lower elastic modulus of crumb rubber particles compared to sand particles contribute to their role as soft patches within the composite, resulting in a overall lower compressive strength [30,31].
It is important to note that the effect of crumb rubber content on the compressive strength of RGC is complex and depends on various factors, including the amount of crumb rubber added, particle size, and the interaction between crumb rubber and the geopolymer matrix. Therefore, optimizing the crumb rubber content is crucial to achieving the desired compressive strength and mechanical properties of RGC, which is one of the objectives of this study. In accordance with JKR 20,800 [32] standards, a minimum compressive strength of 17 MPa is required for slabs or other minor load-bearing elements. As depicted in Figure 3, when the sodium hydroxide concentration ranges between 12 M and 14 M, five out of the thirteen mixes that include crumb rubber at levels of 10–20% meet the compliance criteria.

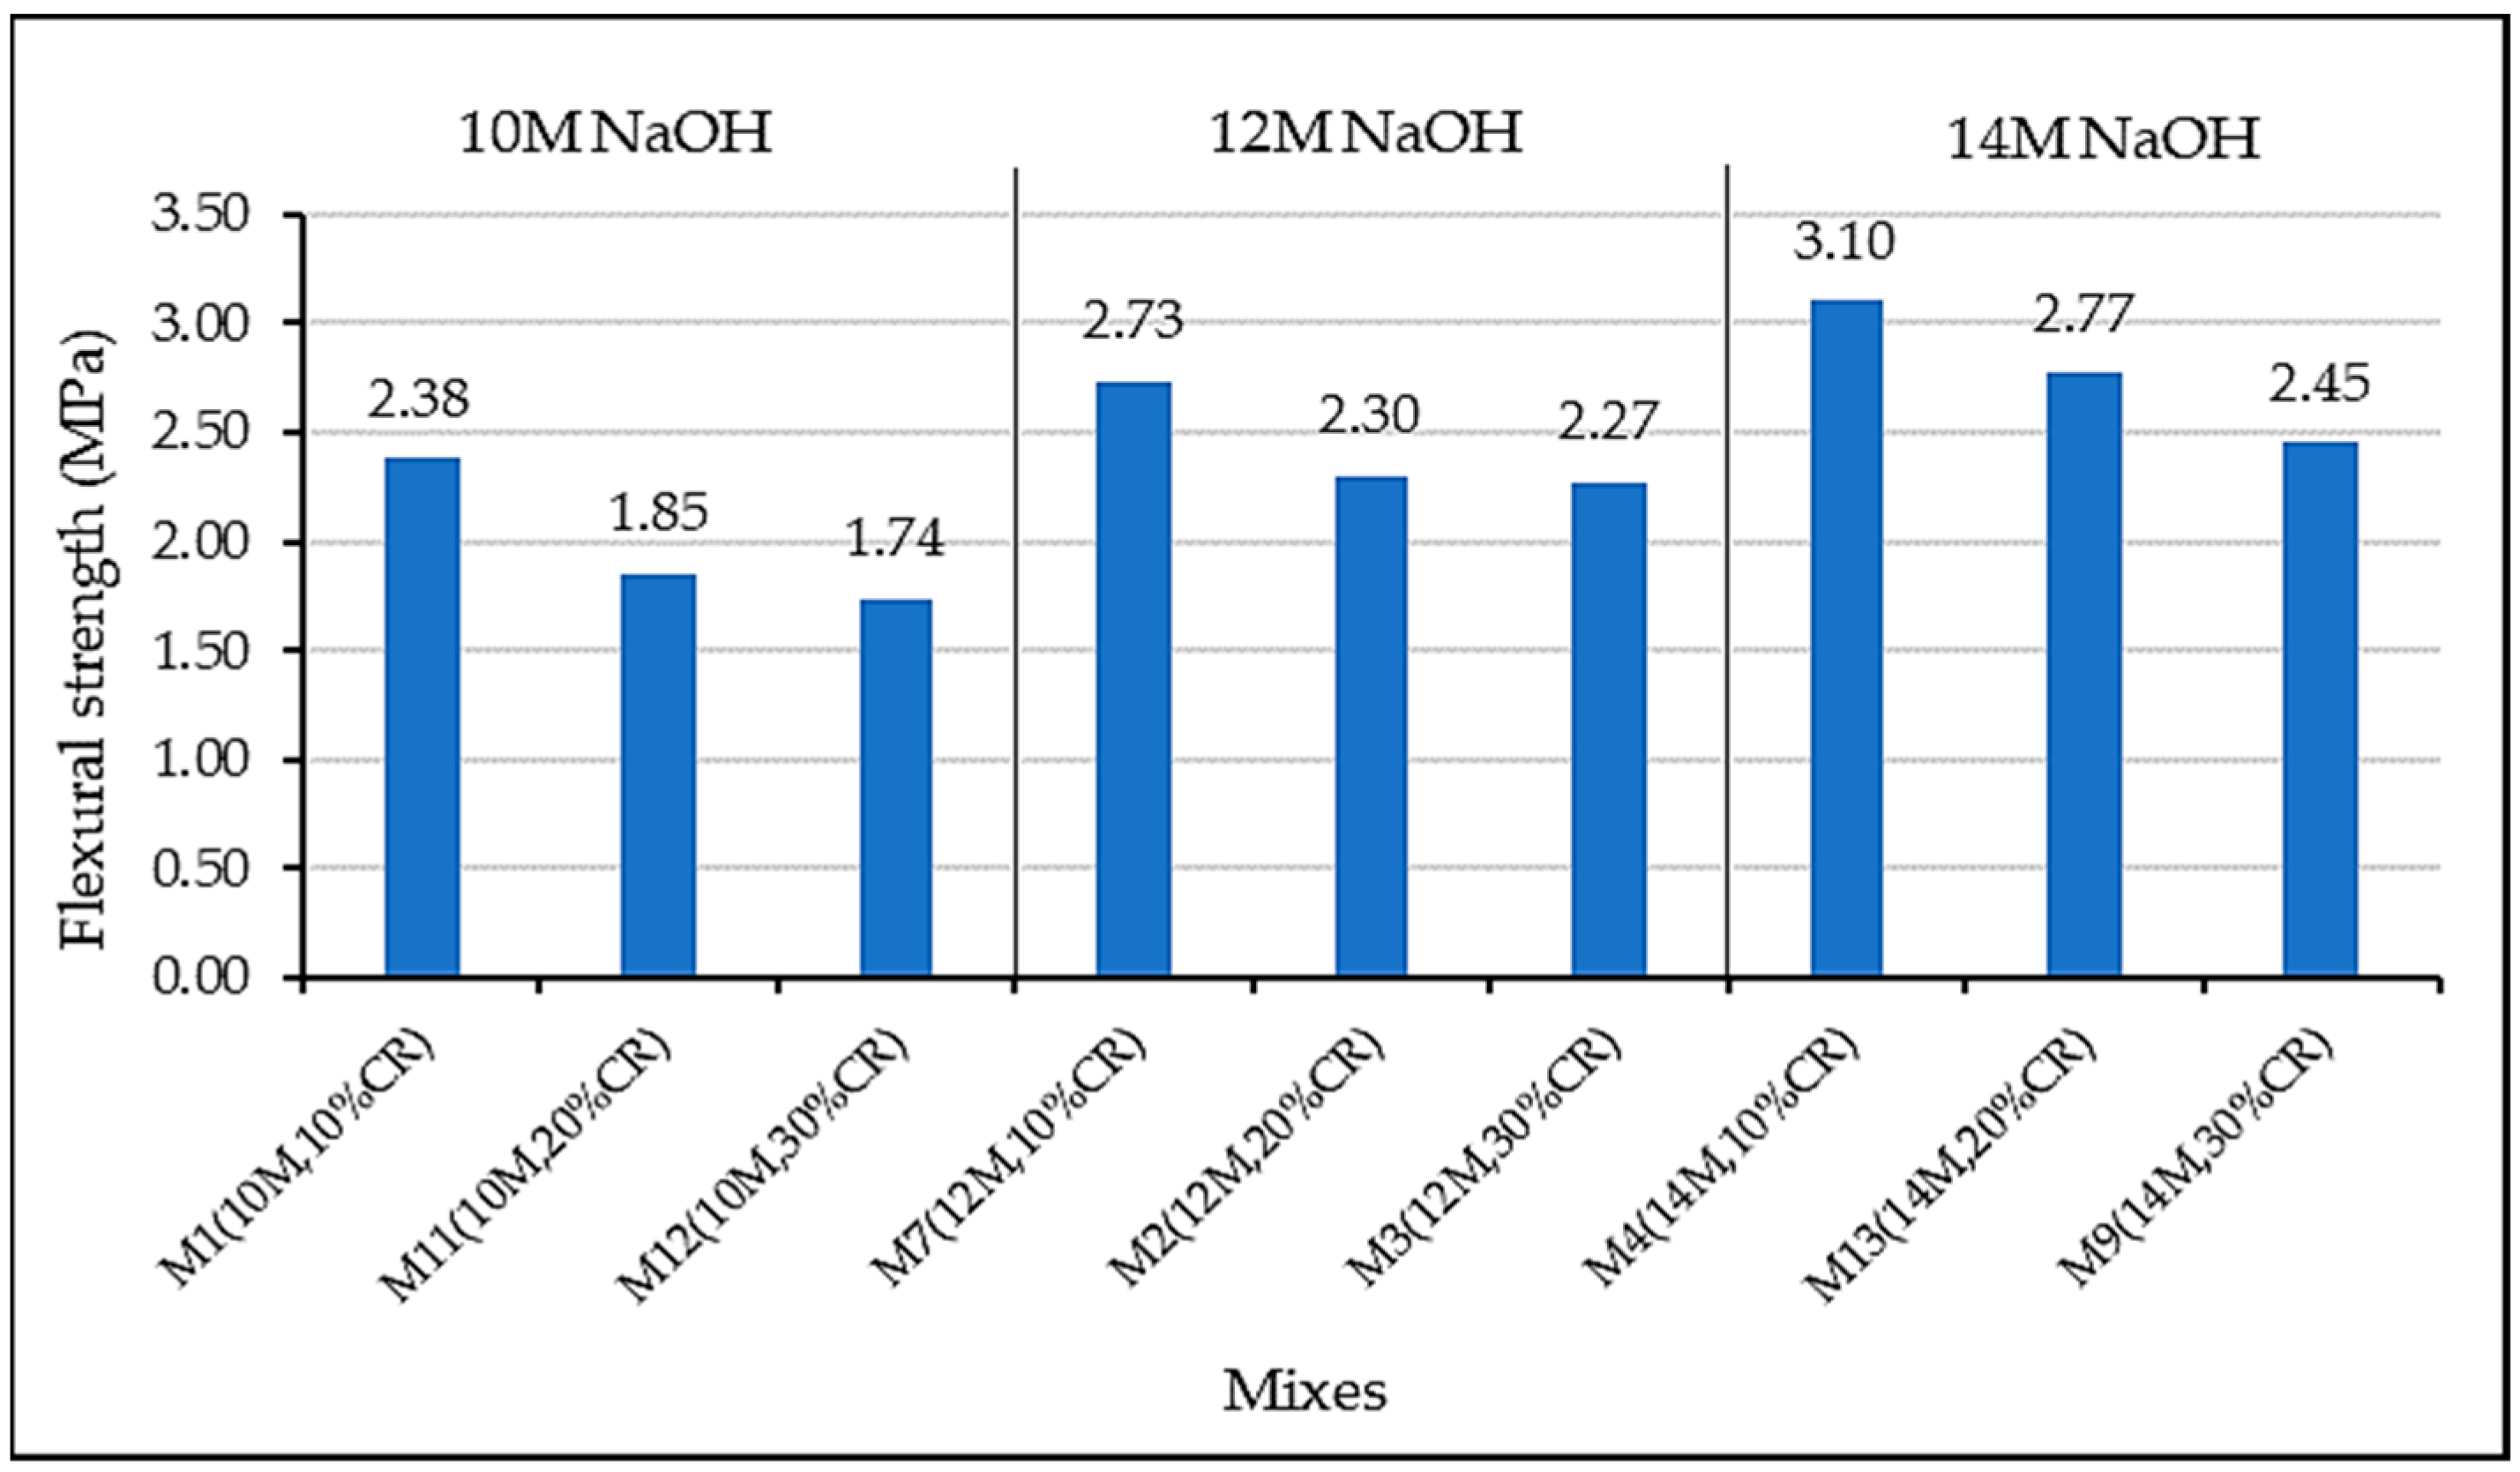
3.1.2. Flexural Strength of RGC

Figure 4 illustrates the flexural strength of the cured rubberized geopolymer concrete after 28 days. Notably, a downward trend in strength values is observed with increasing levels of crumb rubber replacement. This reduction in flexural strength can be attributed to inadequate particle adhesion between the crumb rubber and the geopolymer paste matrix. It is found that the flexural strength is more significantly improved by increasing the molarity of sodium hydroxide rather than by substituting additional CR. Higher NaOH molarities facilitate the development of more geopolymeric linkages and result in a denser microstructure, thereby contributing to increased flexural strength. The presence of crumb rubber contributes to enhanced flexural strength due elastic behavior, which enables it to act as tiny springs inside the RGC to absorb the applied flexural stress. As reported by Aly et al. [33], the RGC can benefit from the reinforcing properties of crumb rubber particles. By absorbing and releasing energy under flexural loading, the rubber particles improve the ductility of the concrete. NaOH helps to increase the interfacial adhesion between the rubber particles and the geopolymer matrix, allowing for more effective energy absorption and stress transmission.
However, it should be noted that there are limitations on the content of crumb rubber beyond which the benefits diminish. Among the tested mixes, Mix 4, which contains 10% crumb rubber and 14 M sodium hydroxide, exhibits the highest flexural strength at age of 28 days, measuring at 3.1 MPa. This amount is consistent with the flexural strength values reported in previous studies at that CR replacement level [34]. On the other hand, mix 12, containing 30% crumb rubber and 10 M sodium hydroxide, demonstrates the lowest flexural strength at 1.74 MPa. Flexural strength plays a crucial role in the structural design of RGC as it indicates the material’s resistance to bending and stiffness. Consequently, it is expected that the flexural strength of the RGC decreases proportionally with the amount of crumb rubber used.
Overall, the findings suggest that the flexural strength of rubberized geopolymer concrete are influenced by the proportion of CR, the molarity of NaOH, and their interaction. Achieving the desired flexural strength and mechanical properties requires careful consideration and the optimization of these factors, which are carried out in this study.

3.1.3. Direct Tensile Strength of RGC

The direct tensile strength of the RGC samples is assessed after a curing period of 28 days, and the results are displayed in Figure 5. Among the tested mixes, Mix 4 (10% crumb rubber and 14 M sodium hydroxide) exhibits superior splitting tensile strength compared to Mix 12 (30% CR, 10 M NaOH), which has the lowest value. Despite the expectation that incorporating CR into geopolymer concrete would enhance its direct tensile behavior by creating a three-dimensional matrix of dispersed rubber particles within the mixture, the findings do not support this hypothesis. The observed values range from 0.198 MPa to 0.48 MPa, which is lower than the anticipated range of 7–15% of the compressive strength as reported in similar studies [34]. A direct tensile testing method was adopted in this study in order to assess the suitability of using that method for RGC. However, several factors contribute to the challenges in accurately measuring the direct tensile strength of the RGC. These include the material’s brittle nature, difficulties in specimen preparation, friction between the specimen and testing machine, specimen size, and the complexity of the testing equipment. Different specimen preparation, size, and friction between the specimen and testing machine can yield varying results in direct tensile tests of RGC. Hence, it is recommended that a more suitable method be employed in future studies to evaluate the tensile behavior of the RGC. However, the overall trend suggests that the tensile strength of RGC may decrease beyond a certain replacement level of CR due to weakened interfacial bonding between the binder and aggregates. On the other hand, NaOH can be utilized to elevate the pH of geopolymer concrete, aiding in the dissolution of source materials and accelerating the formation of geopolymeric linkages. The microstructure and splitting tensile strength of RGC improve as the number of geopolymeric bonds increases.

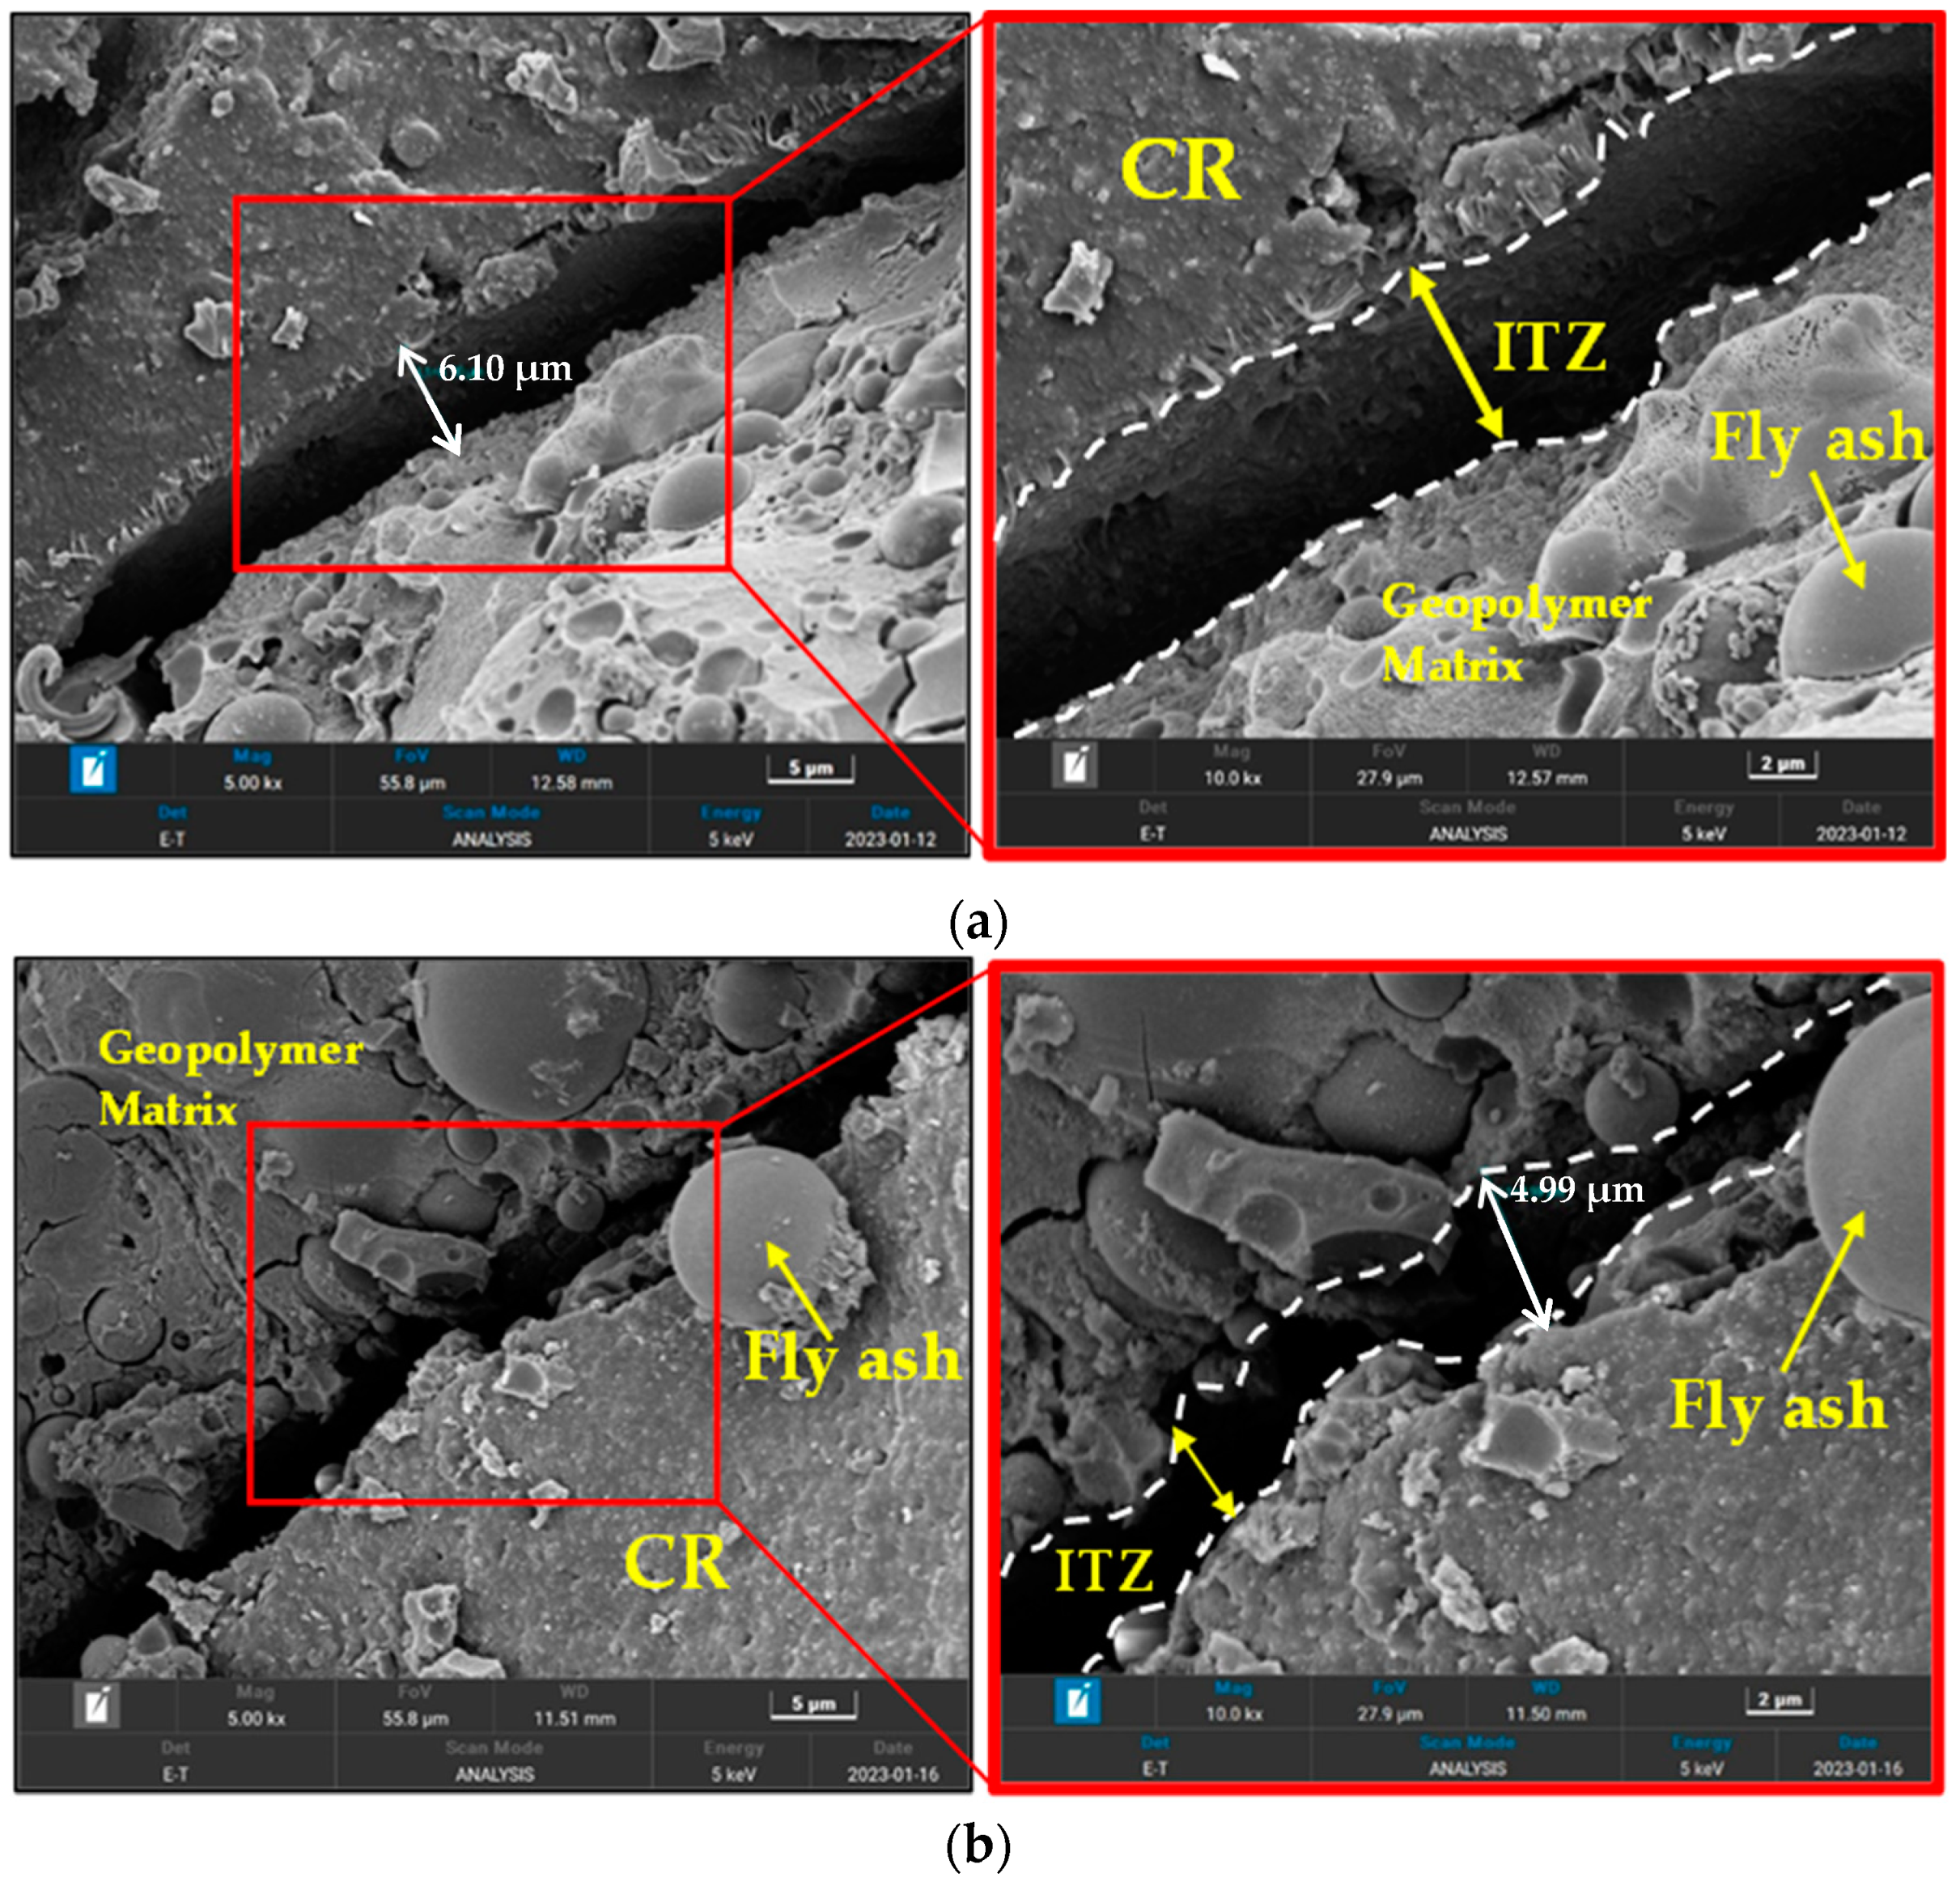
3.2. Microstructural Analysis

Figure 6 presents FESEM images that provide magnified views of the morphology of various RGC mixtures. In line with the mechanical strength results, the microstructure of the different RGC mixes indicated a reduction in the ITZ between the CR and the geopolymer matrix with an increase in the NaOH concentration. For better comparison, samples having the same CR content of 10% but different NaOH concentrations were considered (M1, M4, and M7). In Figure 6a, the mix has 10 M NaOH (M1) and it is evident that the ITZ is very wide, with the CR appearing to have a low amount of the geopolymer paste adhering to its surface. The size of the ITZ is measured to be 6.10 µm. On the other hand, as the molarity of the NaOH increased to 14 M (M7), there is a noticeable decrease in the size of the ITZ measured at 4.99 µm, as shown in Figure 6b. Furthermore, as shown in Figure 6c, when the molarity of NAOH increased to 14 (M4), the ITZ size decreased significantly to 764.32 nm at some point and 347.91 nm at another point. Under close scrutiny, it was also observed that the CR surface was enveloped with the paste, indicating a better reactivity of the CR owing to the NaOH reactivity inducement effect. This led to the improved mechanical strengths of the mixes owing to the better stress transfer at the ITZ. This is in line with the findings of Cong et al. [34] who reported that NaOH enhances the reactivity of crumb rubber surfaces, facilitating improved interaction at the interface with the geopolymer paste. It serves as an alkaline activator, activating and modifying the rubber surface by exposing reactive sites. This alkaline environment initiates hydrolysis reactions, breaking ester and ether linkages, and increasing the availability of reactive sites. The elevated pH resulting from NaOH raises the alkalinity, encouraging solubility and reactivity. Furthermore, NaOH facilitates chemical bonding through reactions with aluminosilicate components in the geopolymer paste, leading to the formation of strong bonds. Additionally, it enables ion exchange processes, allowing for the release of metal ions from the rubber surface and the incorporation of alkali ions from the paste. Collectively, these mechanisms contribute to enhanced adhesion, chemical bonding, and compatibility at the interface, ultimately resulting in improved mechanical properties of the geopolymer composite [34]. This is consistent with the mechanical strength results.

4. Response Surface Methodology (RSM) Analysis

4.1. Response Surface Models

In order to analyse and model the responses, RSM was employed as part of the data analysis in this study. The concentration of NaOH and the replacement levels of CR in fine aggregate, expressed as a percentage, were chosen as the independent variables during the initial stages of the process. The mechanical properties, including compressive strength, flexural strength, and direct tensile strength, were considered as the responses of interest. To gather empirical data on the responses at 28 days, experimental runs were conducted using the Central Composite Design (CCD) approach, as indicated in Table 4. This data was obtained from the actual experimental runs themselves, allowing for a comprehensive analysis of the relationships between the dependent and independent variables (mechanical properties).
As shown in Equations (1)–(3), it has been determined that linear models provide a good fit for compressive (CS) and flexural strengths (FS), while a quadratic model was more suitable for the tensile strength (TS). A and B represent the NaOH concentration and CR replacement, respectively. The equations are presented in terms of the coded factors, where high factor levels are coded as +1 and low levels as −1.
CS = + 16.86 + 4.19 × A 1.72 × B
FS = + 2.33 + 0.253 × A 0.2426 × B
TS = + 0.270 + 0.0605 × A 0.0736 × B 0.0270 × A × B + 0.0105 × A 2 + 0.0355 × B 2

4.2. Analysis of Variance (ANOVA) of The Response Models

Statistical evaluation is done to ascertain the quality of results, and this was achieved using ANOVA. Any model or model term with a probability of less than 5% is statistically significant, as determined by the ANOVA performed at a 95% confidence level. The ANOVA results given in Table 5 are noteworthy because all three models had probability values below 5%. NaOH and CR’s effects on responses were also significant across all developed models, with probability values of less than 5%. All quadratic terms were also significant in the tensile strength model, explaining why the interaction between the two factors affects tensile strength.
The parameters used to validate the model are listed in Table 6. The coefficient of determination (R2) is the most crucial metric since it reveals how well the formulated model fits the experimental data. Note that greater R2 values, expressed either as a percentage or as 0 ≤ R2 ≤ 1 are indicative of better models [32]. The derived models in this example exhibit R2 values of 92% for compressive strength, 72% for flexural strength, and 99% for tensile strength. In addition, the signal-to-noise ratio of a model can be quantified with the help of the Adequate Precision (Adeq. Presc.) value. A ratio greater than four is needed for model design space exploration. Model validation yielded compressive precision values of 20.0219, flexural precision values of 10.6227, and tensile precision values of 43.9728, which are all above the minimum requirement of 4.

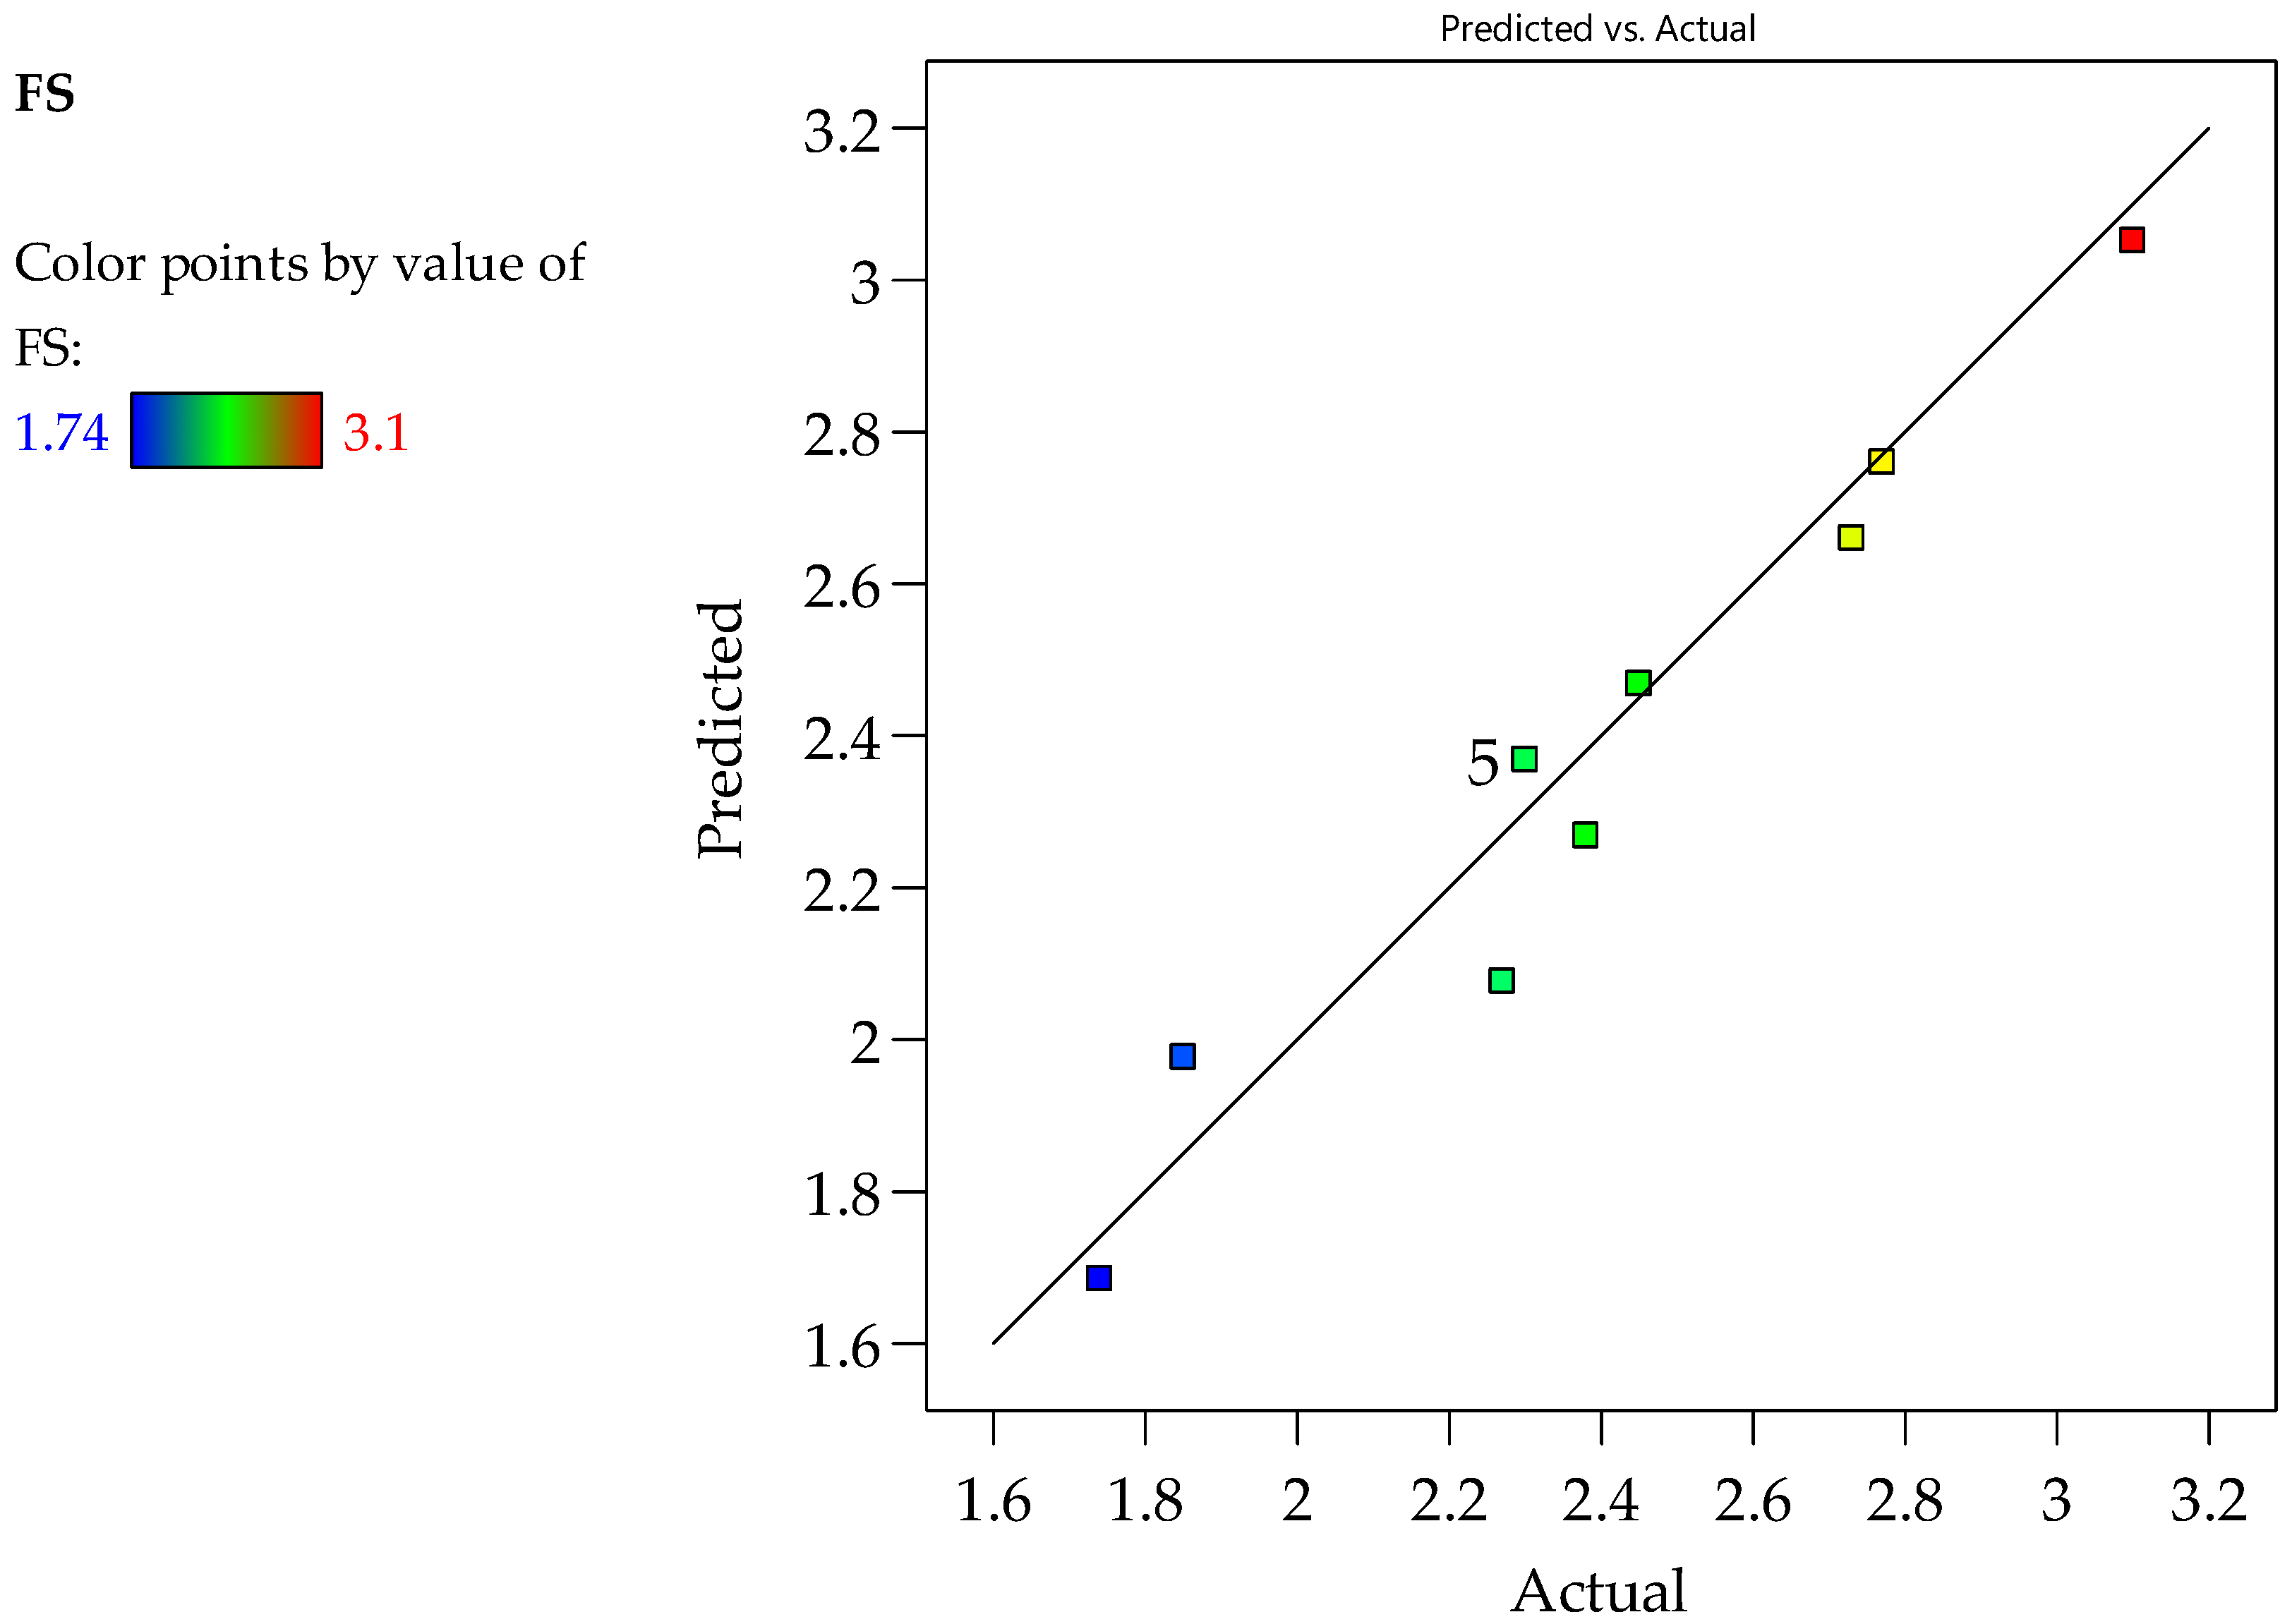
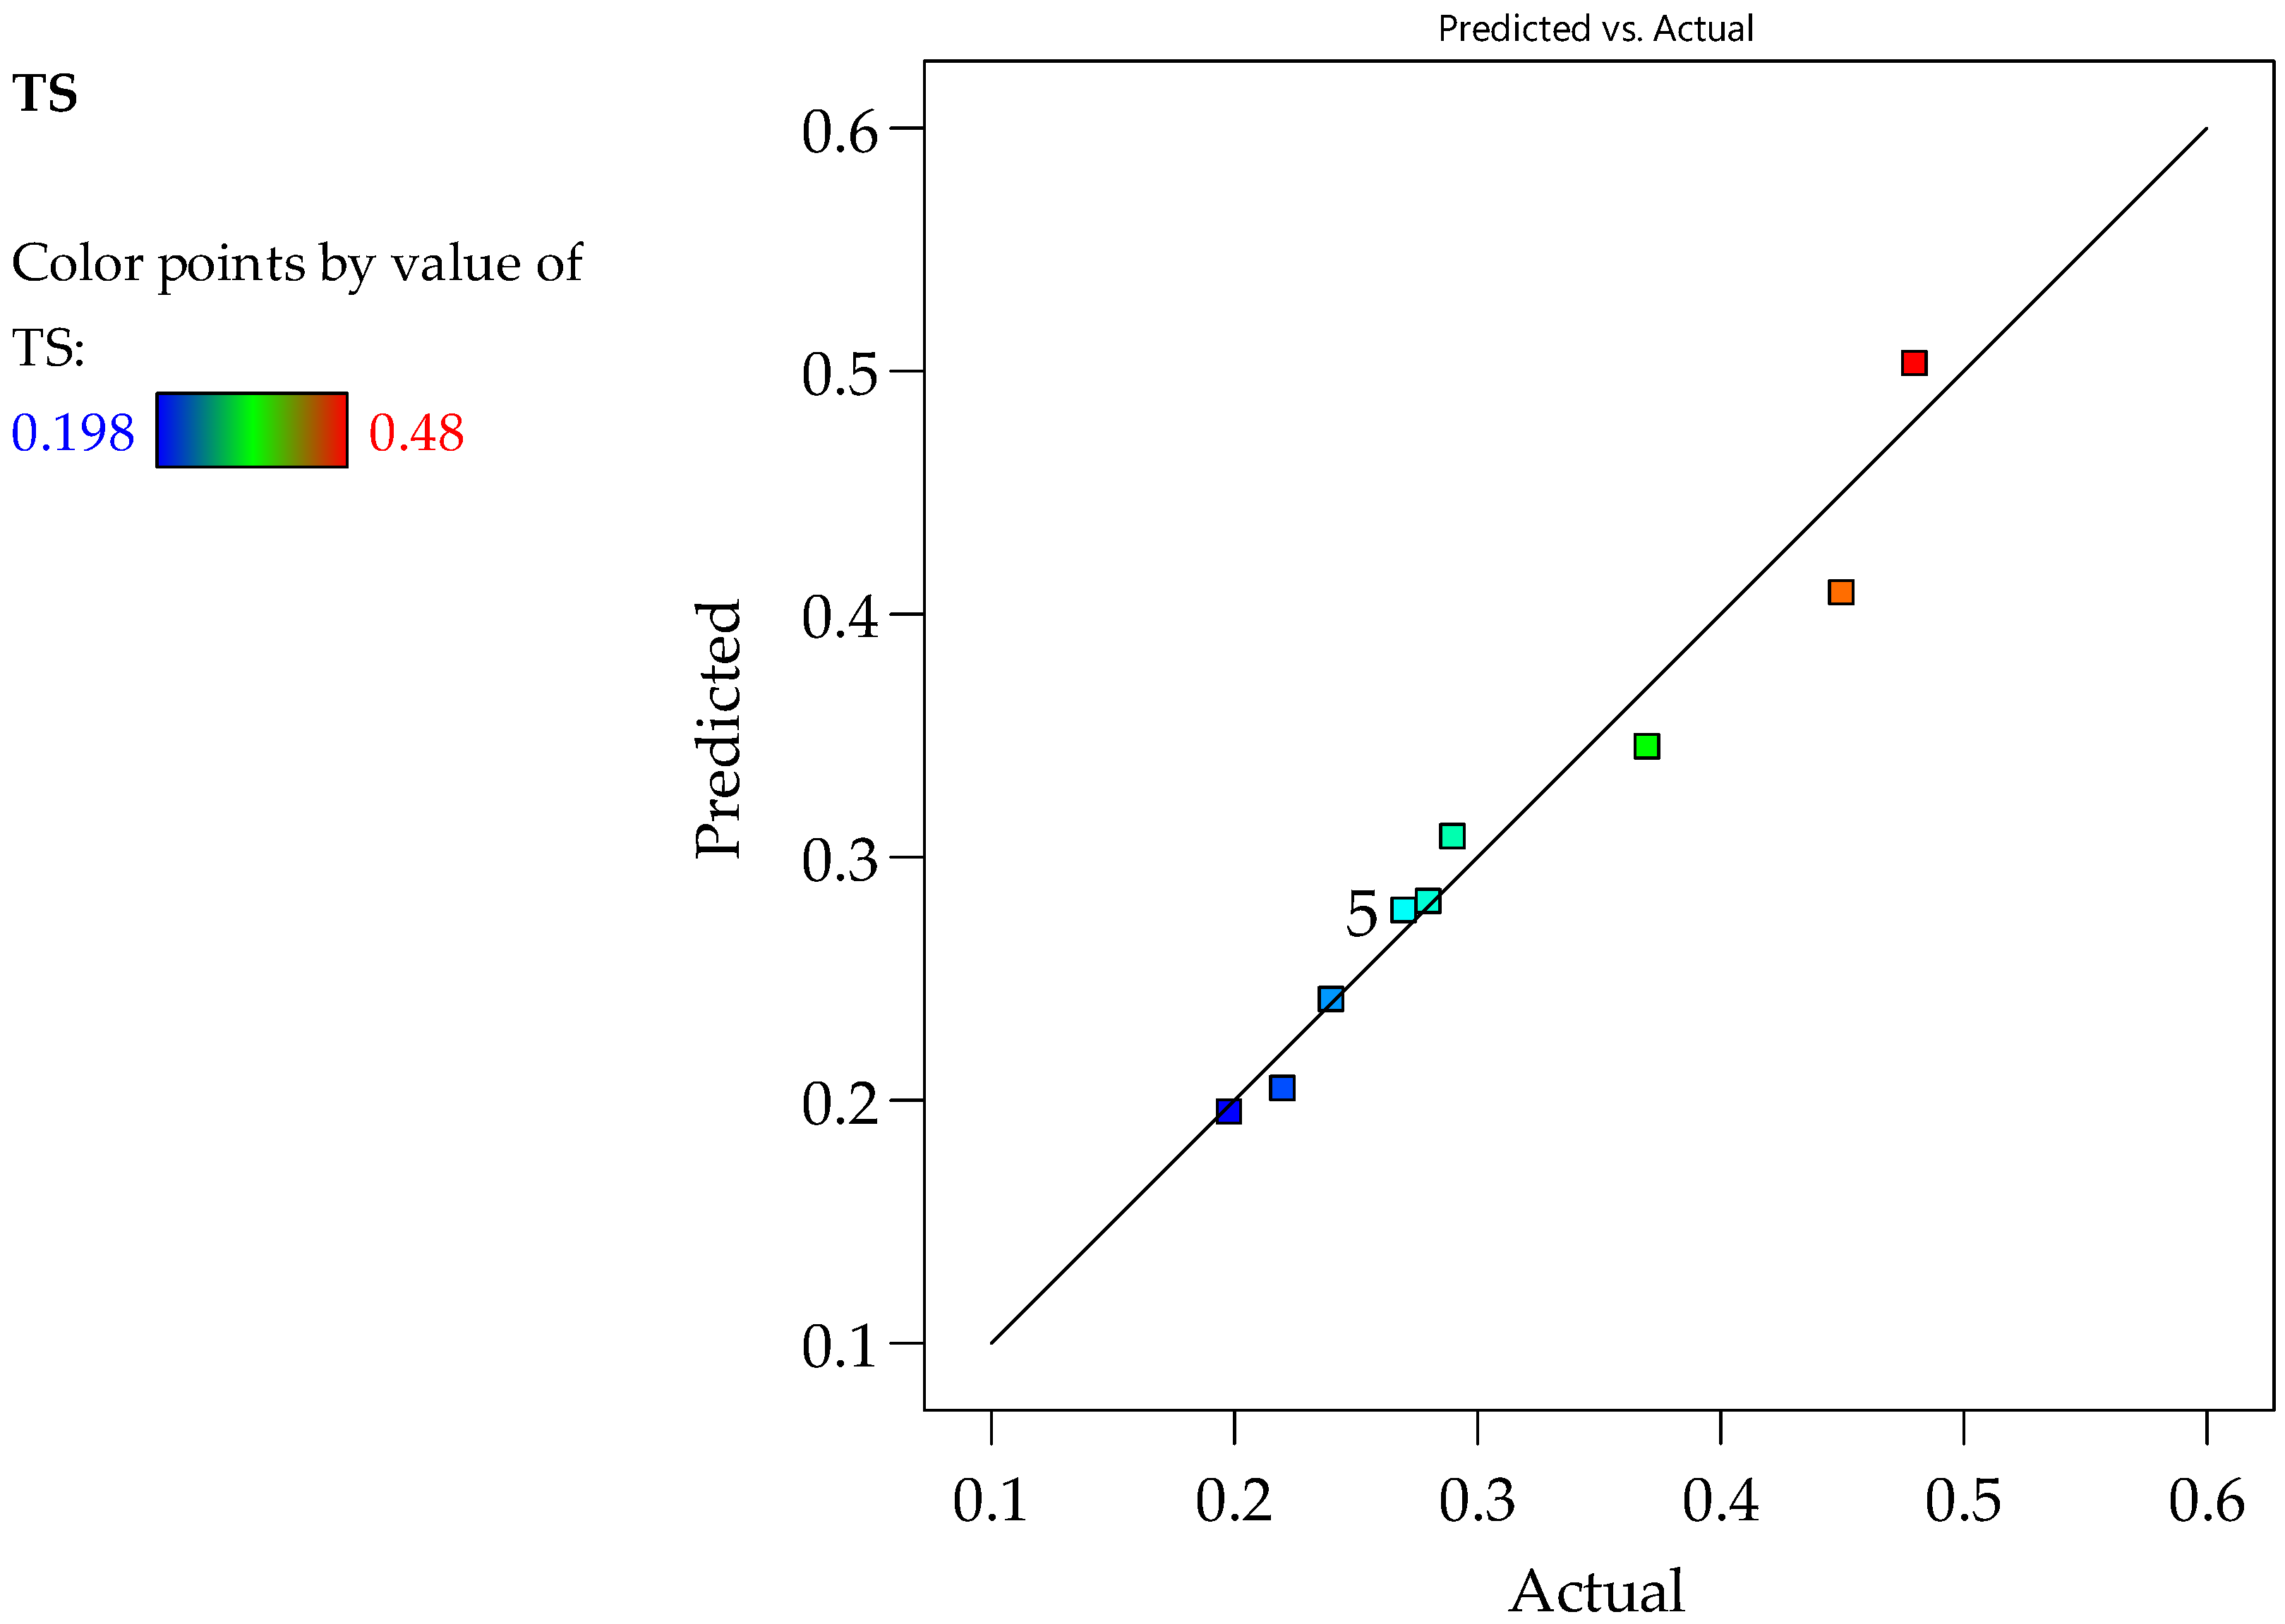
4.3. Model Diagnostics Plot
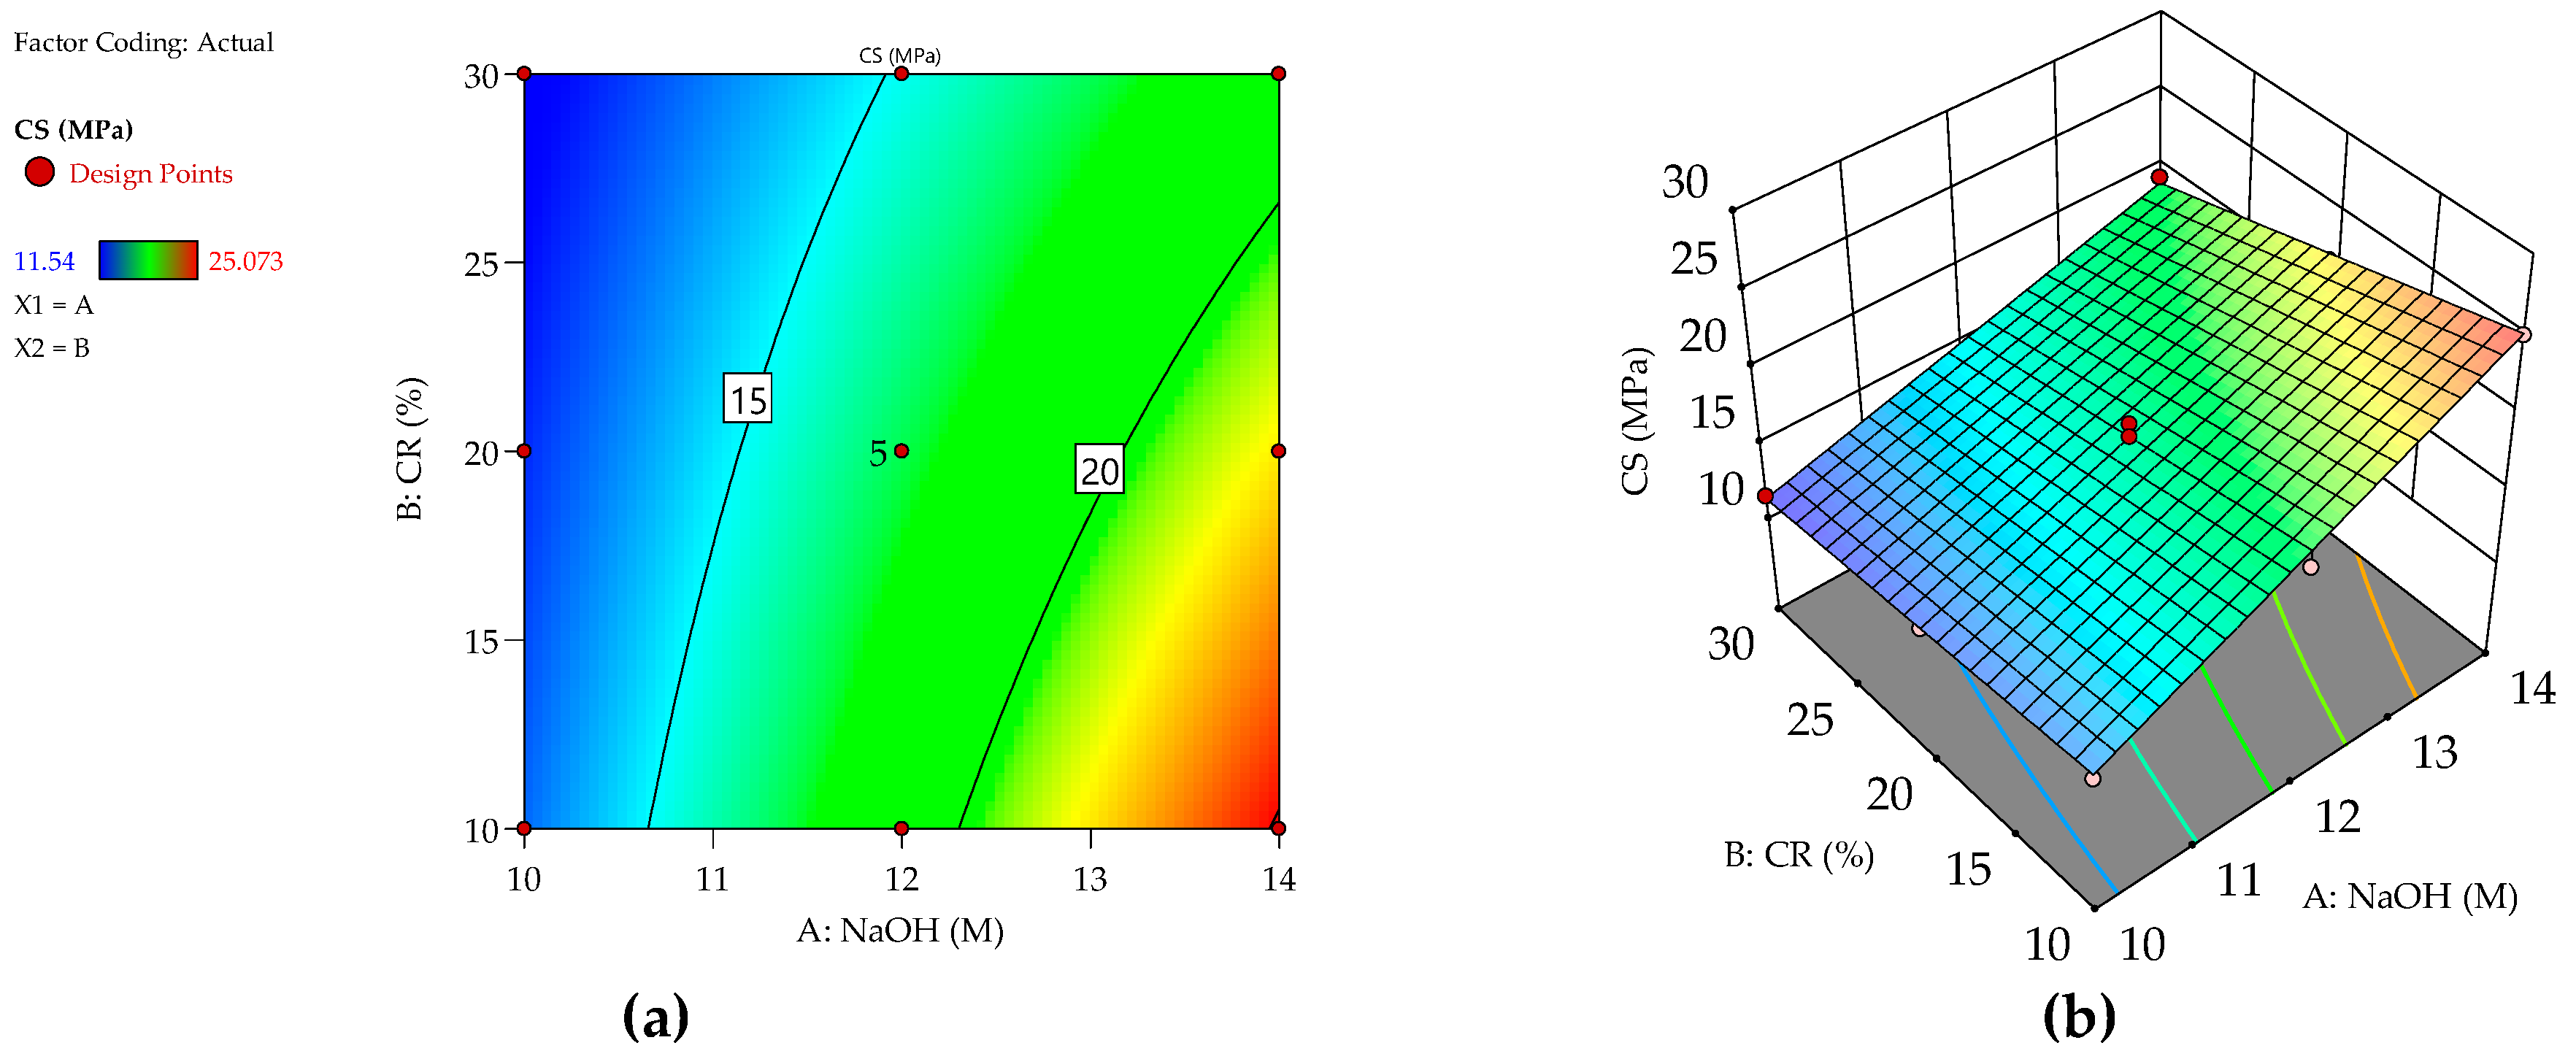
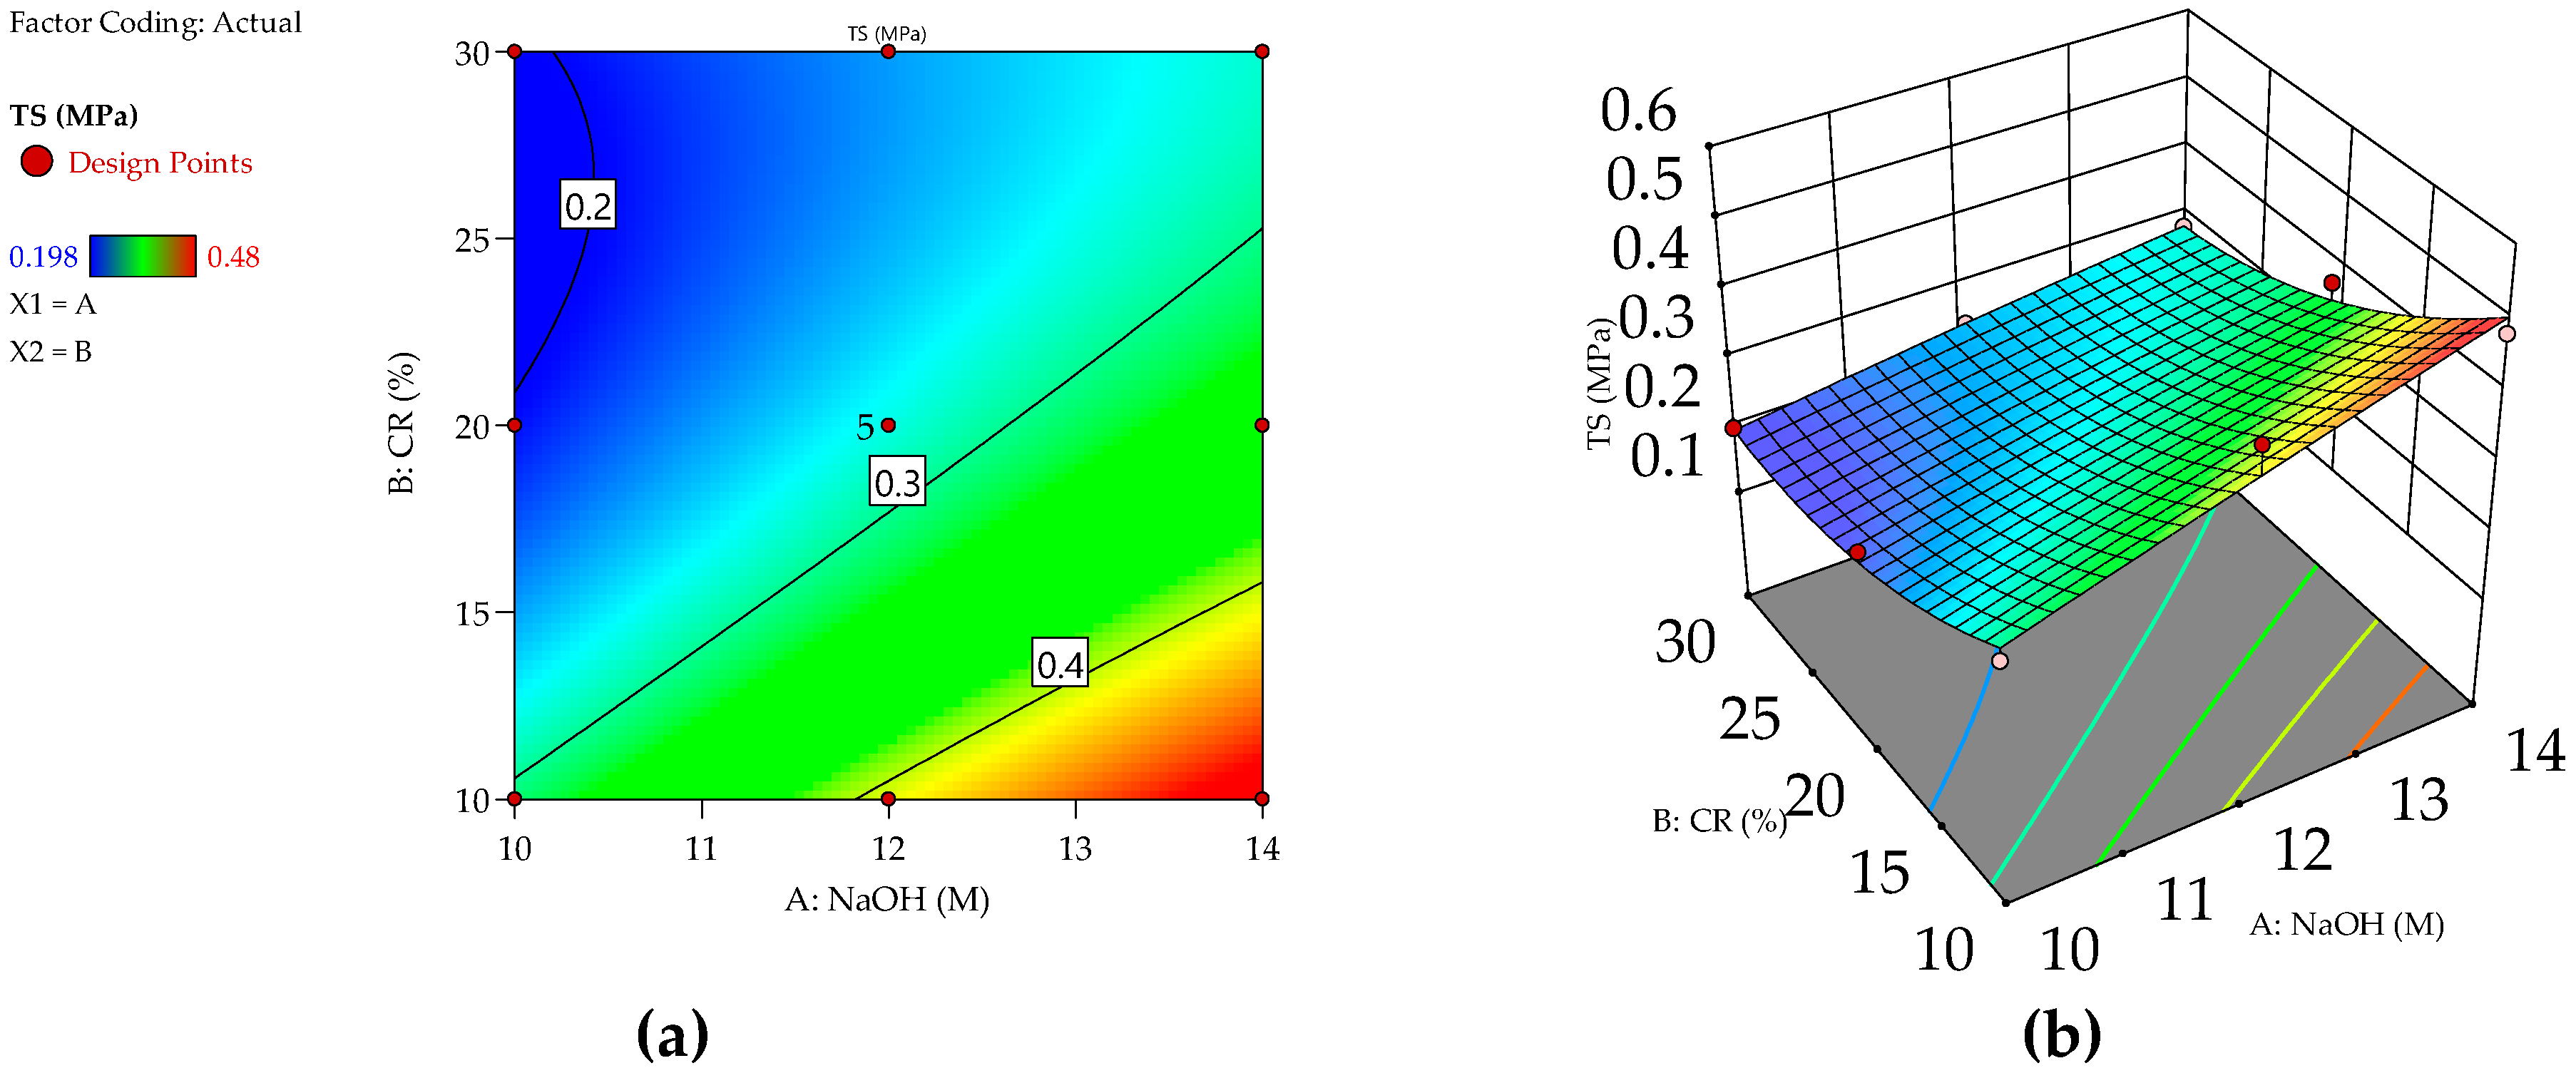
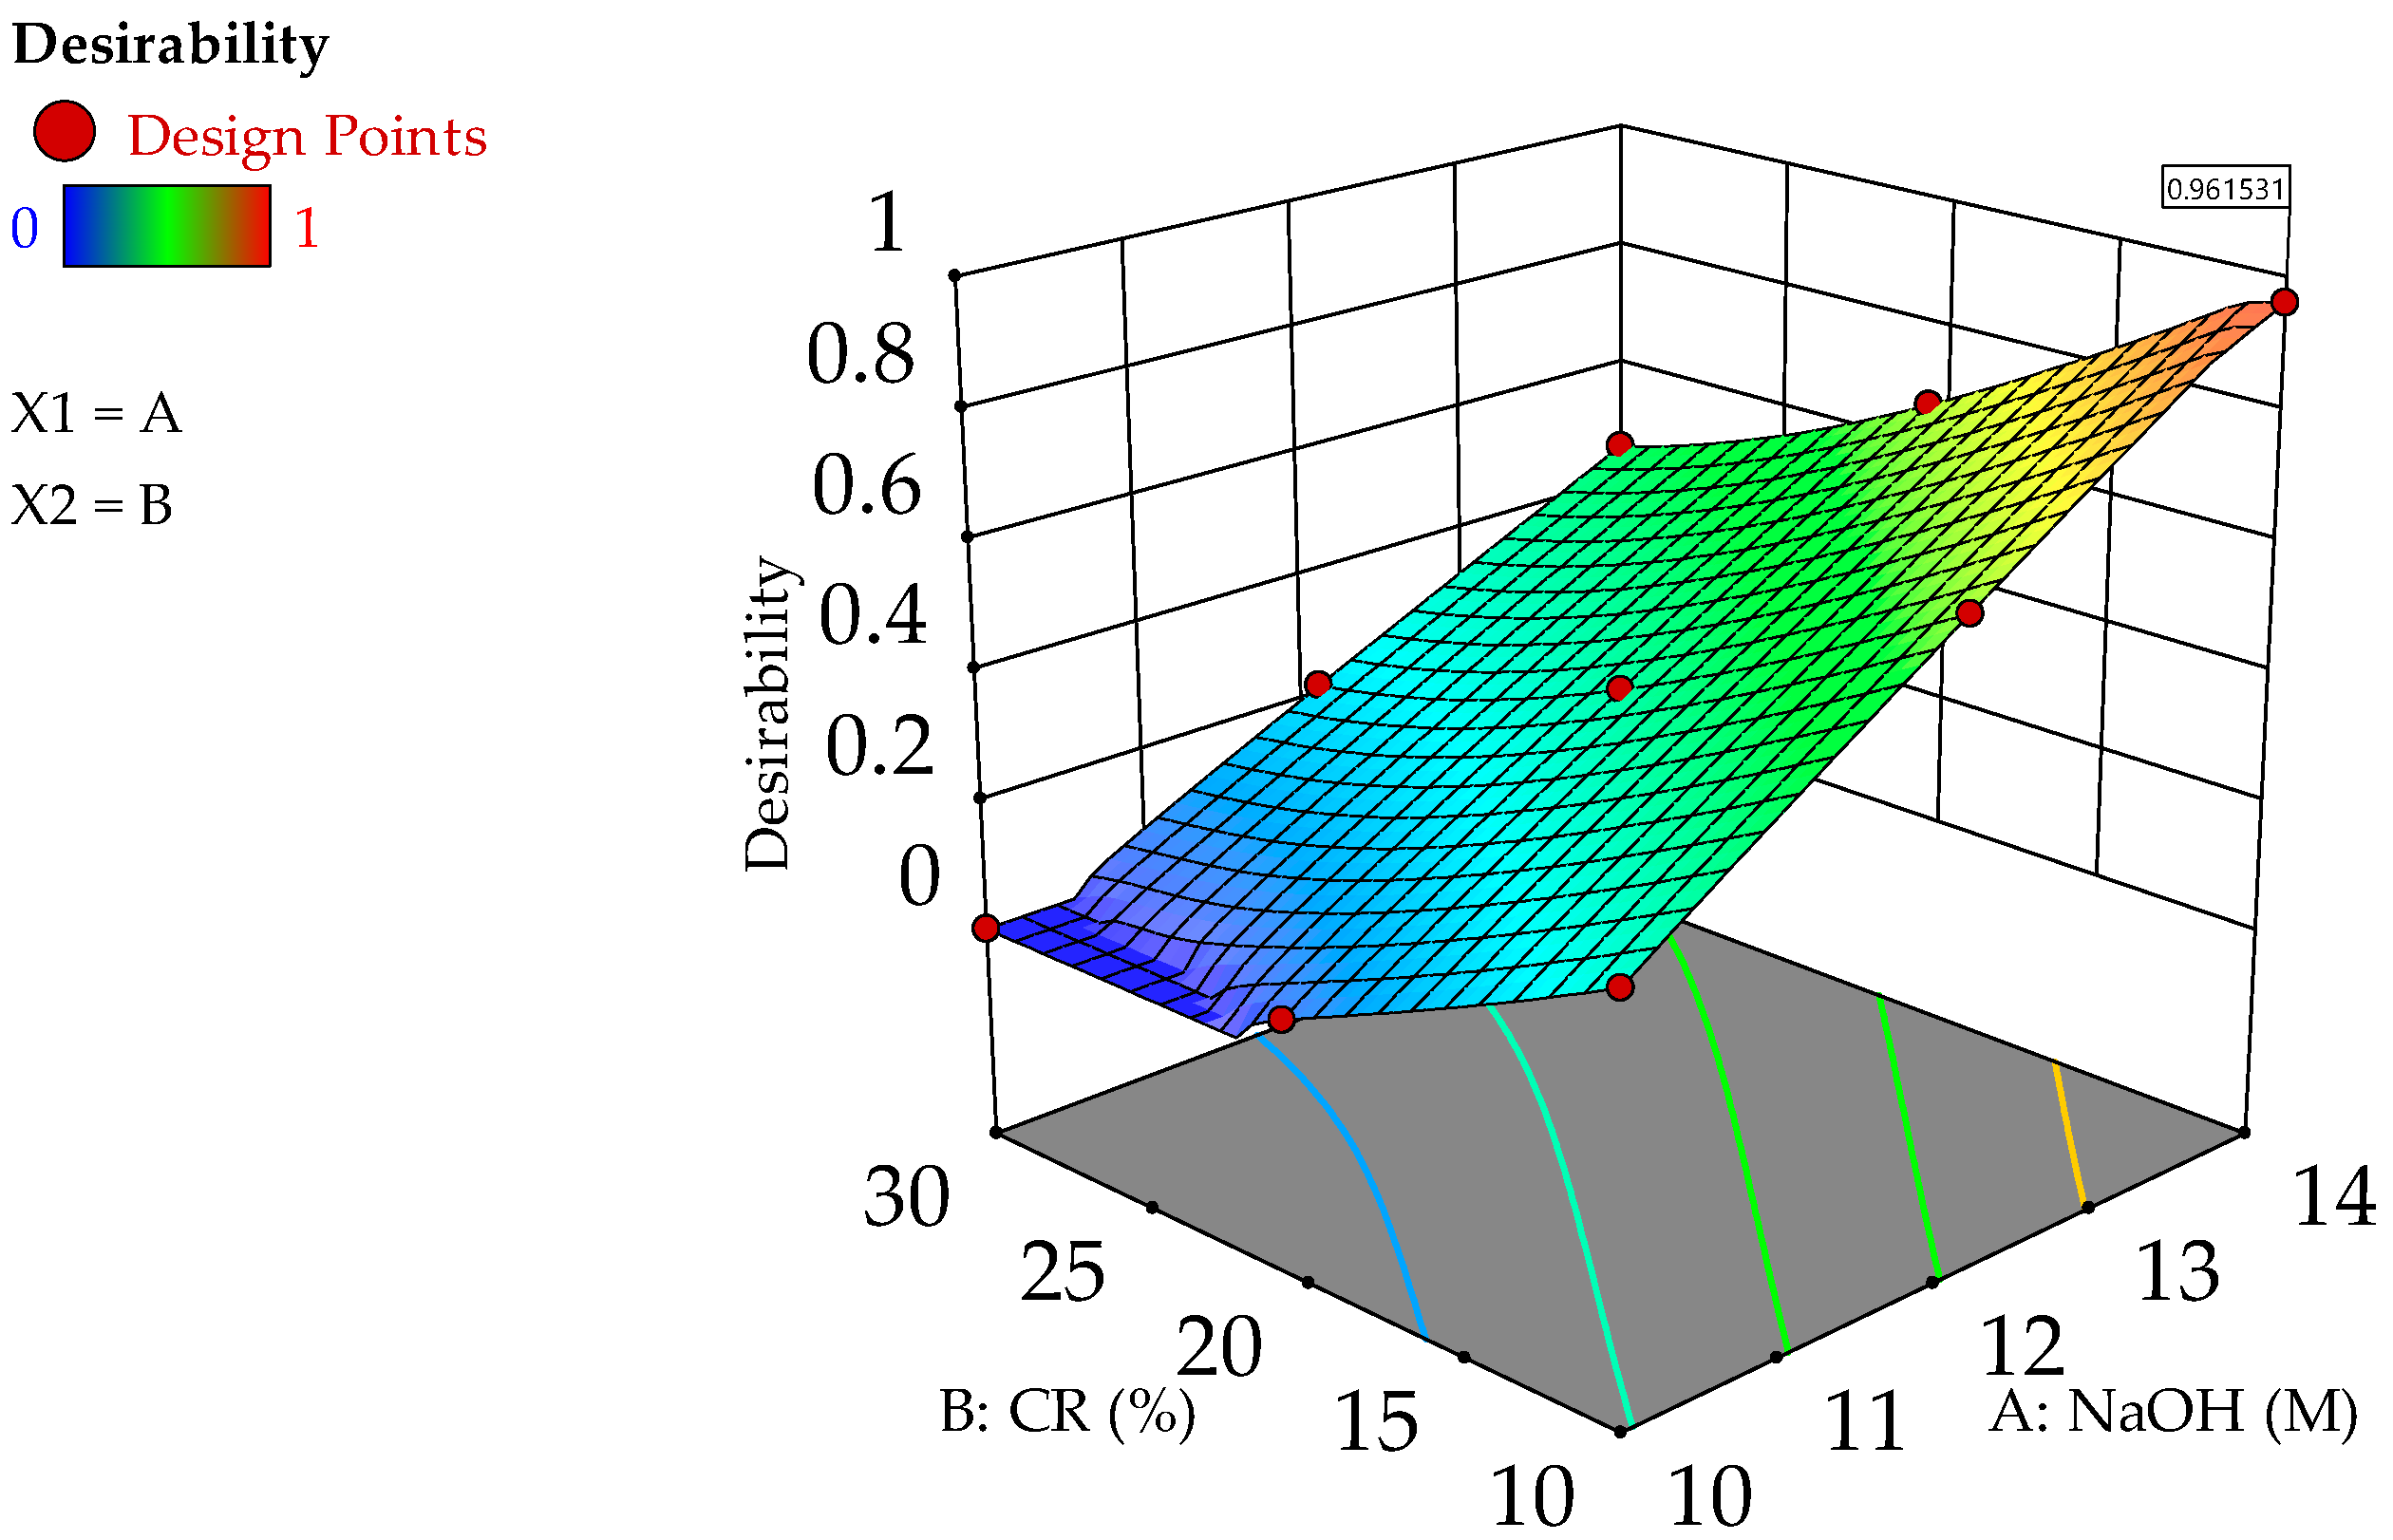
The predicted versus actual graphs for compressive, flexural, and tensile strengths are depicted in Figure 7, Figure 8 and Figure 9, respectively. These charts help to evaluate the accuracy of the models and show how the data from experiments relates to the predictions. The strength and correctness of the models are confirmed by the fact that the data points align along the 45-degree line of fit, which represents a line of best fit between the expected and actual responses [35].

4.4. Model Graphs

The interaction of input variables and their individual and combined impacts on the responses are graphically displayed in the 2D-contour and 3D-response surface diagrams illustrated in (a) and (b), respectively, of Figure 10, Figure 11 and Figure 12. The same data is presented in both 2D and 3D charts, with a color gradient from red (the highest intensity) to blue (the lowest intensity) to represent magnitude. Generally speaking, the graphs suggest that increasing the NaOH molarity resulted in stronger composites. This agrees with what was said earlier about the composites’ mechanical strengths. The physical and chemical performance of the rubber particles has been substantially improved due to the interaction of the CR and the NaOH inside the mixes.

4.5. Optimization

The main aim and the novelty of this study is to optimize the key variables involved in the development of RGC, and, by extension, the performance (responses) of the composite using the RSM approach. This will help establish the ideal quantity of NaOH and CR replacement levels required for the desired RGC mechanical performance. In order to complete the objective function, several goals are set for the input elements and the responses. The optimization outcome is given a score between 0 and 1 (or 0 to 100%), which is known as the desirability value. Table 7 displays the system’s optimal mixture for the input variables and the desired responses (compressive, flexural, and tensile strengths, respectively) based on the specified criteria and level of significance. Considering the experiment’s variables and the wide range of possible results, this is a very encouraging number. According to the optimization procedure, 14 M of NAOH and 10% of CR are the optimum levels for the two input variables. The optimal mechanical properties for the given RGC are a compressive strength of 22.77 MPa, flexural strength of 2.83 MPa, and tensile strength of 0.477 MPa. Figure 13 and Figure 14 depict optimization solution ramps and a 3D response surface representation of the desirability value, respectively.

4.6. Experimental Validation

The optimization was verified experimentally by producing an RGC mixture with the optimal concentrations of the input variables (CR: 10%, and NaOH: 14 M). After 28 days, the samples were examined, and the experimental results, along with the expected outcomes, are shown in Table 8. Using Equation (4), the percentage error was determined, and the result is also included in Table 8. The developed response models are reliable because the margin of error for all the responses is within a suitable range, as shown by the % error numbers. Furthermore, Figure 15 and Figure 16 indicate the predicted vs. response plot and also the kite diagram for the predicted data, which shows that the predicted is matching with the experimental results obtained and hence the validation is accurate. Figure 17 also shows the Weibull fit for the compressive and flexural strength obtained via these experimental results, which is well within confidence levels showing the relevance of the results.
Experimental   error δ = Experimental   value Predicted   value Predicted   value × 100

5. Conclusions

This study successfully employed RSM to optimize and model the effects of NaOH concentrations and CR replacement levels of fine aggregate on the mechanical strengths of rubberized geopolymer concrete. The key conclusions drawn from the findings are as follows:
  • The experimental findings indicate a decrease in the mechanical strengths of the composite with an increase in CR replacement. Conversely, an improvement in strengths is observed with an increase in NaOH concentration. Notably, raising the NaOH concentration from 10 M to 14 M resulted in a substantial 49% enhancement in compressive strength.
  • Increasing the percentages of CR led to a decrease in the mechanical strength. It is worth mentioning that the tensile strength at the fracture point exhibited a strong correlation with the flexural strength at the same point, attributed to increased internal stress perpendicular to the applied load, resulting from weak areas in the geopolymer concrete mix caused by inadequate bonding between crumb rubber and the geopolymer matrix.
  • Empirical models were successfully developed to accurately predict the responses. The compressive and flexural strengths were effectively modelled as linear functions, while the direct tensile strength was best described by a quadratic function. The ANOVA validation of these models demonstrated high R2 values, ranging from 72 to 99%, indicating their reliability.
  • The outcomes of the multi-objective optimization analysis determined that the optimal levels of variables for creating RGC with acceptable mechanical properties for structural applications were 14 M NaOH and 10% CR.
  • This study focused on investigating the fundamental mechanical strengths (compressive, flexural, and tensile) within the specified range of 10–14 M sodium hydroxide and 10–30% CR replacement. However, in order to ensure a comprehensive understanding of the long-term reliability and behaviour of RGP, further research is recommended to explore the effects of factors that extend beyond these ranges. The optimization of the durability and long-term properties of the RGC within the variables range and beyond also need to investigated.

Author Contributions

Conceptualization, B.S.M. and M.S.L.; methodology, B.S.M. and M.S.L.; software, Y.G.A/L.P.G. and I.A.; validation, B.S.M., I.A. and P.S.; formal analysis, I.A. and Y.G.A/L.P.G.; investigation, Y.G.A/L.P.G.; resources, B.S.M., M.S.L. and N.A.W.A.Z.; data curation, Y.G.A/L.P.G.; writing—original draft preparation, P.S. and G.R.; writing—review and editing, I.A. and G.R.; supervision, B.S.M.; project administration, B.S.M., M.S.L. and N.A.W.A.Z.; funding acquisition, B.S.M. and M.S.L. All authors have read and agreed to the published version of the manuscript.

Funding

This research was funded by Universiti Teknologi PETRONAS (UTP) Malaysia under Yayasan UTP grants with numbers 015LC0-328 and 015LC0-391.

Data Availability Statement

Not applicable.

Conflicts of Interest

The authors declare no conflict of interest.

References

  1. Barbhuiya, S.; Pang, E. Strength and Microstructure of Geopolymer Based on Fly Ash and Metakaolin. Materials 2022, 15, 3732. [Google Scholar] [CrossRef]
  2. Kankia, M.U.; Baloo, L.; Danlami, N.; Mohammed, B.S.; Haruna, S.; Abubakar, S.; Jagaba, A.H.; Sayed, K.; Abdulkadir, I.; Salihi, U.I. Performance of Fly Ash-Based Inorganic Polymer with Petroleum Sludge Ash. Polymers 2021, 13, 4143. [Google Scholar] [CrossRef] [PubMed]
  3. Golewski, G.L. Green Concrete Based on Quaternary Binders with Significant Reduced of CO2 Emissions. Energies 2021, 14, 4558. [Google Scholar] [CrossRef]
  4. Gartner, E. Industrially interesting approaches to ‘low-CO2’ cements. Cem. Concr. Res. 2003, 34, 1489–1498. [Google Scholar] [CrossRef]
  5. Haruna, S.; Mohammed, B.S.; Wahab, M.M.A.; Al-Fakih, A. Effect of aggregate-binder proportion and curing technique on the strength and water absorption of fly ash-based one-part geopolymer mortars. IOP Conf. Ser. Mater. Sci. Eng. 2021, 1101, 012022. [Google Scholar] [CrossRef]
  6. Mohammed, B.S.; Haruna, S.; Wahab, M.M.A.; Liew, M.S. Optimization and characterization of cast in-situ alkali-activated pastes by response surface methodology. Constr. Build. Mater. 2019, 225, 776–787. [Google Scholar] [CrossRef]
  7. Kankia, M.U.; Baloo, B.; Mohammed, B.S.; Hassan, S.B.; Haruna, S.; Danlami, N.; Ishak, E.A.; Samahani, W.N. Effects of petroleum sludge ash in fly ash-based geopolymer. Constr. Build. Mater. 2021, 272, 121939. [Google Scholar] [CrossRef]
  8. Razak, S.N.; Shafiq, N.; Nikbakht, E.H.; Mohammed, B.S.; Guillaumat, L.; Farhan, S.A. Fire performance of fly-ash-based geopolymer concrete: Effect of burning temperature on mechanical and microstructural properties. Mater. Today Proc. 2022, 66, 2665–2669. [Google Scholar] [CrossRef]
  9. Mohammed, B.S.; Hossain, K.M.A.; Swee, J.T.E.; Wong, G.; Abdullahi, M. Properties of crumb rubber hollow concrete block. J. Clean. Prod. 2012, 23, 57–67. [Google Scholar] [CrossRef]
  10. Al-Fakih, A.; Mohammed, B.S.; Liew, M.S.; Nikbakht, E. Incorporation of waste materials in the manufacture of masonry bricks: An update review. J. Build. Eng. 2019, 21, 37–54. [Google Scholar] [CrossRef]
  11. Mohammed, B.S.; Adamu, M. Mechanical performance of roller compacted concrete pavement containing crumb rubber and nano silica. Constr. Build. Mater. 2018, 159, 234–251. [Google Scholar] [CrossRef]
  12. Mohammed, B.S.; Khed, V.C.; Nuruddin, M.F. Rubbercrete mixture optimization using response surface methodology. J. Clean. Prod. 2018, 171, 1605–1621. [Google Scholar] [CrossRef]
  13. Mohammed, B.S. Structural behavior and m–k value of composite slab utilizing concrete containing crumb rubber. Constr. Build. Mater. 2010, 24, 1214–1221. [Google Scholar] [CrossRef]
  14. Mohammed, B.S.; Azmi, N.J. Strength reduction factors for structural rubbercrete. Front. Struct. Civ. Eng. 2014, 8, 270–281. [Google Scholar] [CrossRef]
  15. Mohammed, B.S.; Adamu, M.; Liew, M.S. Evaluating the effect of crumb rubber and nano silica on the properties of high volume fly ash roller compacted concrete pavement using non-destructive techniques. Case Stud. Constr. Mater. 2018, 8, 380–391. [Google Scholar] [CrossRef]
  16. Shu, X.; Huang, B. Recycling of waste tire rubber in asphalt and Portland cement concrete: An overview. Constr. Build. Mater. 2014, 67, 217–224. [Google Scholar] [CrossRef]
  17. Siddique, R.; Naik, T.R. Properties of concrete containing scrap-tire rubber—An overview. Waste Manag. 2004, 24, 563–569. [Google Scholar] [CrossRef]
  18. Guo, S.; Dai, Q.; Si, R.; Sun, X.; Lu, C. Evaluation of properties and performance of rubber-modified concrete for recycling of waste scrap tire. J. Clean. Prod. 2017, 148, 681–689. [Google Scholar] [CrossRef]
  19. Wongsa, A.; Sata, V.; Nematollahi, V.; Sanjayan, S.; Chindaprasirt, P. Mechanical and thermal properties of lightweight geopolymer incorporating crumb rubber. J. Clean. Prod. 2018, 195, 1069–1080. [Google Scholar] [CrossRef]
  20. Azmi, A.A.; Abdullah, M.M.A.B.; Ghazali, C.M.R.; Sandu, A.V.; Hussin, K. Effect of Crumb Rubber on Compressive Strength of Fly Ash Based Geopolymer Concrete. MATEC Web Conf. 2016, 78, 1063. [Google Scholar] [CrossRef]
  21. Luhar, I.; Luhar, S. Rubberized Geopolymer Composites: Value-Added Applications. J. Compos. Sci. 2021, 5, 312. [Google Scholar] [CrossRef]
  22. Mohammed, B.S.; Liew, M.S.; Alaloul, W.S.; Al-Fakih, A.; Ibrahim, W.; Adamu, M. Development of rubberized geopolymer interlocking bricks. Case Stud. Constr. Mater. 2018, 8, 401–408. [Google Scholar] [CrossRef]
  23. Metwally, A.A.A.; Mariam, M.F.; Omar, H.K. Mechanical and thermal properties of fibrous rubberized geopolymer. Constr. Build. Mater. 2020, 3547, 129192. [Google Scholar] [CrossRef]
  24. Abdulaziz, A.; Albidah, A.; Abadel, A.; Abbas, H.; Al-Salloum, Y. Development of metakaolin-based geopolymer rubberized concrete: Fresh and hardened properties. Arch. Civ. Mech. Eng. 2022, 22, 144. [Google Scholar] [CrossRef]
  25. Xiao, R.; Shen, Z.; Si, R.; Polaczyk, P.; Li, Y.; Zhou, H.; Huang, B. Alkali-activated slag (AAS) and OPC-based composites containing crumb rubber aggregate: Physico-mechanical properties, durability and oxidation of rubber upon NaOH treatment. J. Clean. Prod. 2022, 367, 132896. [Google Scholar] [CrossRef]
  26. Pham, T.M.; Liu, J.; Tran, P.; Pang, V.-L.; Shi, F.; Chen, W.; Hao, H.; Tran, T.M. Dynamic compressive properties of lightweight rubberized geopolymer concrete. Constr. Build. Mater. 2020, 265, 120753. [Google Scholar] [CrossRef]
  27. Aslani, F.; Deghani, A.; Asif, Z. Development of lightweight rubberized geopolymer concrete by using polystyrene and recycled crumb-rubber aggregates. J. Mater. Civ. Eng. 2020, 32, 04019345. [Google Scholar] [CrossRef]
  28. BS EN 12390-3:2019; Testing Hardened Concrete Part 3: Compressive Strength of Test Specimens. British Standards Institution (BSI): London, UK, 2019.
  29. Chowdhury, S.; Mohapatra, S.; Gaur, A.; Dwivedi, G.; Soni, A. Study of various properties of geopolymer concrete—A review. Mater. Today Proc. 2021, 46, 5687–5695. [Google Scholar] [CrossRef]
  30. Abdulkadir, I.; Mohammed, B.S.; Liew, M.S.; Wahab, M.M.A. Modelling and Optimization of the Impact Resistance of Graphene Oxide Modified Crumb Rubber-ECC Using Response Surface Methodology. IOP Conf. Ser. Mater. Sci. Eng. 2021, 1197, 012043. [Google Scholar] [CrossRef]
  31. Abdulkadir, I.; Mohammed, B.S.; Liew, M.S.; Wahab, M.M.A. Effect of Graphene Oxide and Crumb Rubber on the Drying Shrinkage Behavior of Engineered Cementitious Composite (ECC): Experimental Study, RSM—Based Modelling and Optimization. In Sustainable Practices and Innovations in Civil Engineering; Springer: Singapore, 2021. [Google Scholar] [CrossRef]
  32. JRK 20800; Standard Specifications for Building Works. Jabatan Kerja Raya Malaysia: Kuala Lumpur, Malaysia, 2005.
  33. Aly, A.M.; El-Feky, M.S.; Kohail, M.; Nasr, E.-S.A.R. Performance of geopolymer concrete containing recycled rubber. Constr. Build. Mater. 2019, 207, 136–144. [Google Scholar] [CrossRef]
  34. Cong, P.; Cheng, Y. Advances in geopolymer materials: A comprehensive review. J. Traffic Transp. Eng. (Engl. Ed.) 2021, 8, 283–314. [Google Scholar] [CrossRef]
  35. Abdulkadir, I.; Mohammed, B.S.; Ali, M.O.A.; Liew, M.S. Effects of Graphene Oxide and Crumb Rubber on the Fresh Properties of Self-Compacting Engineered Cementitious Composite Using Response Surface Methodology. Materials 2022, 15, 2519. [Google Scholar] [CrossRef] [PubMed]
Figure 1. Some of the key ingredients (a) Class F fly ash; (b) crumb rubber.
Buildings 13 02021 g001
Figure 2. (a) Compressive Strength Test of RGC. (b) Direct Tensile Test of RGC. (c) Flexural Strength Test of RGC.
Buildings 13 02021 g002
Figure 3. Compressive Strength Results.
Buildings 13 02021 g003
Figure 4. Flexural Strength Result.
Buildings 13 02021 g004
Figure 5. Direct tensile strength of RGC mixes at 28 days.
Buildings 13 02021 g005
Figure 6. FESEM Micrographs (a) M1 (NaOH: 10 M, CR: 10%) (b) M7 (NaOH: 10 M, CR: 10%) (c) M4 (NaOH: 10 M, CR: 10%).
Buildings 13 02021 g006aBuildings 13 02021 g006b
Figure 7. Actual vs. Predicted Graph for Compressive Strength.
Buildings 13 02021 g007
Figure 8. Actual vs. Predicted Graph for Flexural Strength.
Buildings 13 02021 g008
Figure 9. Actual vs. Predicted Graph for Tensile Strength.
Buildings 13 02021 g009
Figure 10. (a) 2D Contour Graph and (b) 3D Response Surface diagram for Compressive Strength.
Buildings 13 02021 g010
Figure 11. (a) 2D Contour Graph and (b) 3D Response Surface diagram for Flexural Strength.
Buildings 13 02021 g011
Figure 12. (a) 2D Contour Graph and (b) 3D Response Surface diagram for Tensile Strength.
Buildings 13 02021 g012
Figure 13. Optimization Ramp.
Buildings 13 02021 g013
Figure 14. Response Surface Diagram for Desirability.
Buildings 13 02021 g014
Figure 15. Predicted vs. response plot for the optimized values.
Buildings 13 02021 g015
Figure 16. KITE diagram for the predicted vs. response plot.
Buildings 13 02021 g016
Figure 17. Weibull plot for (a) compressive strength (b) flexural strength.
Buildings 13 02021 g017
Table 1. Chemical composition of Fly ash.
OxidesCaOSiO2Fe2O3Al2O3K2OMgOSO3P2O5TiO2MnONa2OLoss on Ignition%
Percentage (%)6.5762.49.1715.31.490.770.651.231.320.770.391.25
Table 2. Physical properties of aggregates and CR.
Physical PropertiesFine AggregatesCrumb Rubber
Specific Gravity2.650.54
Water Absorption (%)2.1-
Moisture Content (%)1.3-
Fineness Modulus2.22.36
Table 3. Rubberized Geopolymer concrete Mix proportion.
RunFactor A: NaOH (M)Factor B: CR (%)Fly Ash (kg/m3)CR (kg/m3)Fine Aggregate (kg/m3)NaOH (kg/m3)Sodium Silicate (kg/m3)
110105003380545113
212205006771545113
3123050010065645113
414105003380545113
512205006771545113
612205006771545113
712105003380545113
812205006771545113
9143050010065645113
1012205006771545113
1110205006771545113
12103050010065645113
1314205006771545113
Table 4. RSM variables and responses.
RunVariablesResponses
NaOH, (M)CR, %Compressive Strength
(MPa)
Flexural Strength
(MPa)
Tensile Strength
(MPa)
28-Days
1101012.7132.380.29
2122017.132.30.27
3123013.1272.270.24
4141025.0733.10.48
5122017.9672.30.27
6122017.9672.30.27
7121017.9672.730.45
8122017.9672.30.27
9143019.3172.450.28
10122017.9672.30.27
11102012.1871.850.22
12103011.541.740.198
13142021.6372.770.37
Table 5. ANOVA Result.
ResponseSourceSum of SquaresdfMean SquareF-Valuep-ValueSignificance
CS (MPa)Model164.01282.0054.07<0.0001Yes
A-NaOH140.291140.2992.51<0.0001Yes
B-CR23.71123.7115.640.0027Yes
Residual15.17101.52
Lack of Fit15.1762.53
Pure Error0.000040.0000
Cor Total179.1712
FS (MPa)Model0.982820.491413.030.0016Yes
A-NaOH0.512110.512113.570.0042Yes
B-CR0.470710.470712.480.0054Yes
Residual0.3772100.0377
Lack of Fit0.377260.0629
Pure Error0.000040.0000
Cor Total1.3612
TS (MPa)Model0.084650.0169204.48<0.0001Yes
A-NaOH0.029310.0293354.13<0.0001Yes
B-CR0.043410.0434524.13<0.0001Yes
AB0.002910.002935.250.0006Yes
A20.000810.00089.270.0187Yes
B20.008810.0088105.97<0.0001Yes
Residual0.000670.0001
Lack of Fit0.000630.0002
Pure Error0.000040.0000
Cor Total0.085212
Table 6. Model Validation.
Model Validation
Parameter
CS (Mpa)FS (Mpa)TS (Mpa)
Std.Dev.1.230.1940.0091
Mean16.862.330.2983
CV %7.308.343.05
R20.91540.72260.9932
Adj.R20.89840.66710.9883
Pred.R20.8150.39120.9516
Adeq. Precision20.02110.62243.972
Table 7. Optimization Goals and Results.
FactorsInput FactorsResponses (Output Factors)
NaOH (M)CR (%)CS (MPa)FS (MPa)TS (MPa)
ValueMinimum101012.712.380.29
Maximum143019.322.450.28
GoalIn rangeIn rangeMaximizeMaximizeMaximize
Optimization Result141022.772.830.477
Desirability0.83 (83%)
Table 8. Experimental Validation Response.
PredictedExperimentalError (%)
CS (MPa)22.7725.0710.10
FS (MPa)2.833.109.54
TS (MPa)0.470.482.13
Disclaimer/Publisher’s Note: The statements, opinions and data contained in all publications are solely those of the individual author(s) and contributor(s) and not of MDPI and/or the editor(s). MDPI and/or the editor(s) disclaim responsibility for any injury to people or property resulting from any ideas, methods, instructions or products referred to in the content.

