
NiFe Alloy Nanoparticles Tuning the Structure, Magnetism, and Application for Oxygen Evolution Reaction Catalysis

Abstract
:1. Introduction
2. Materials and Methods
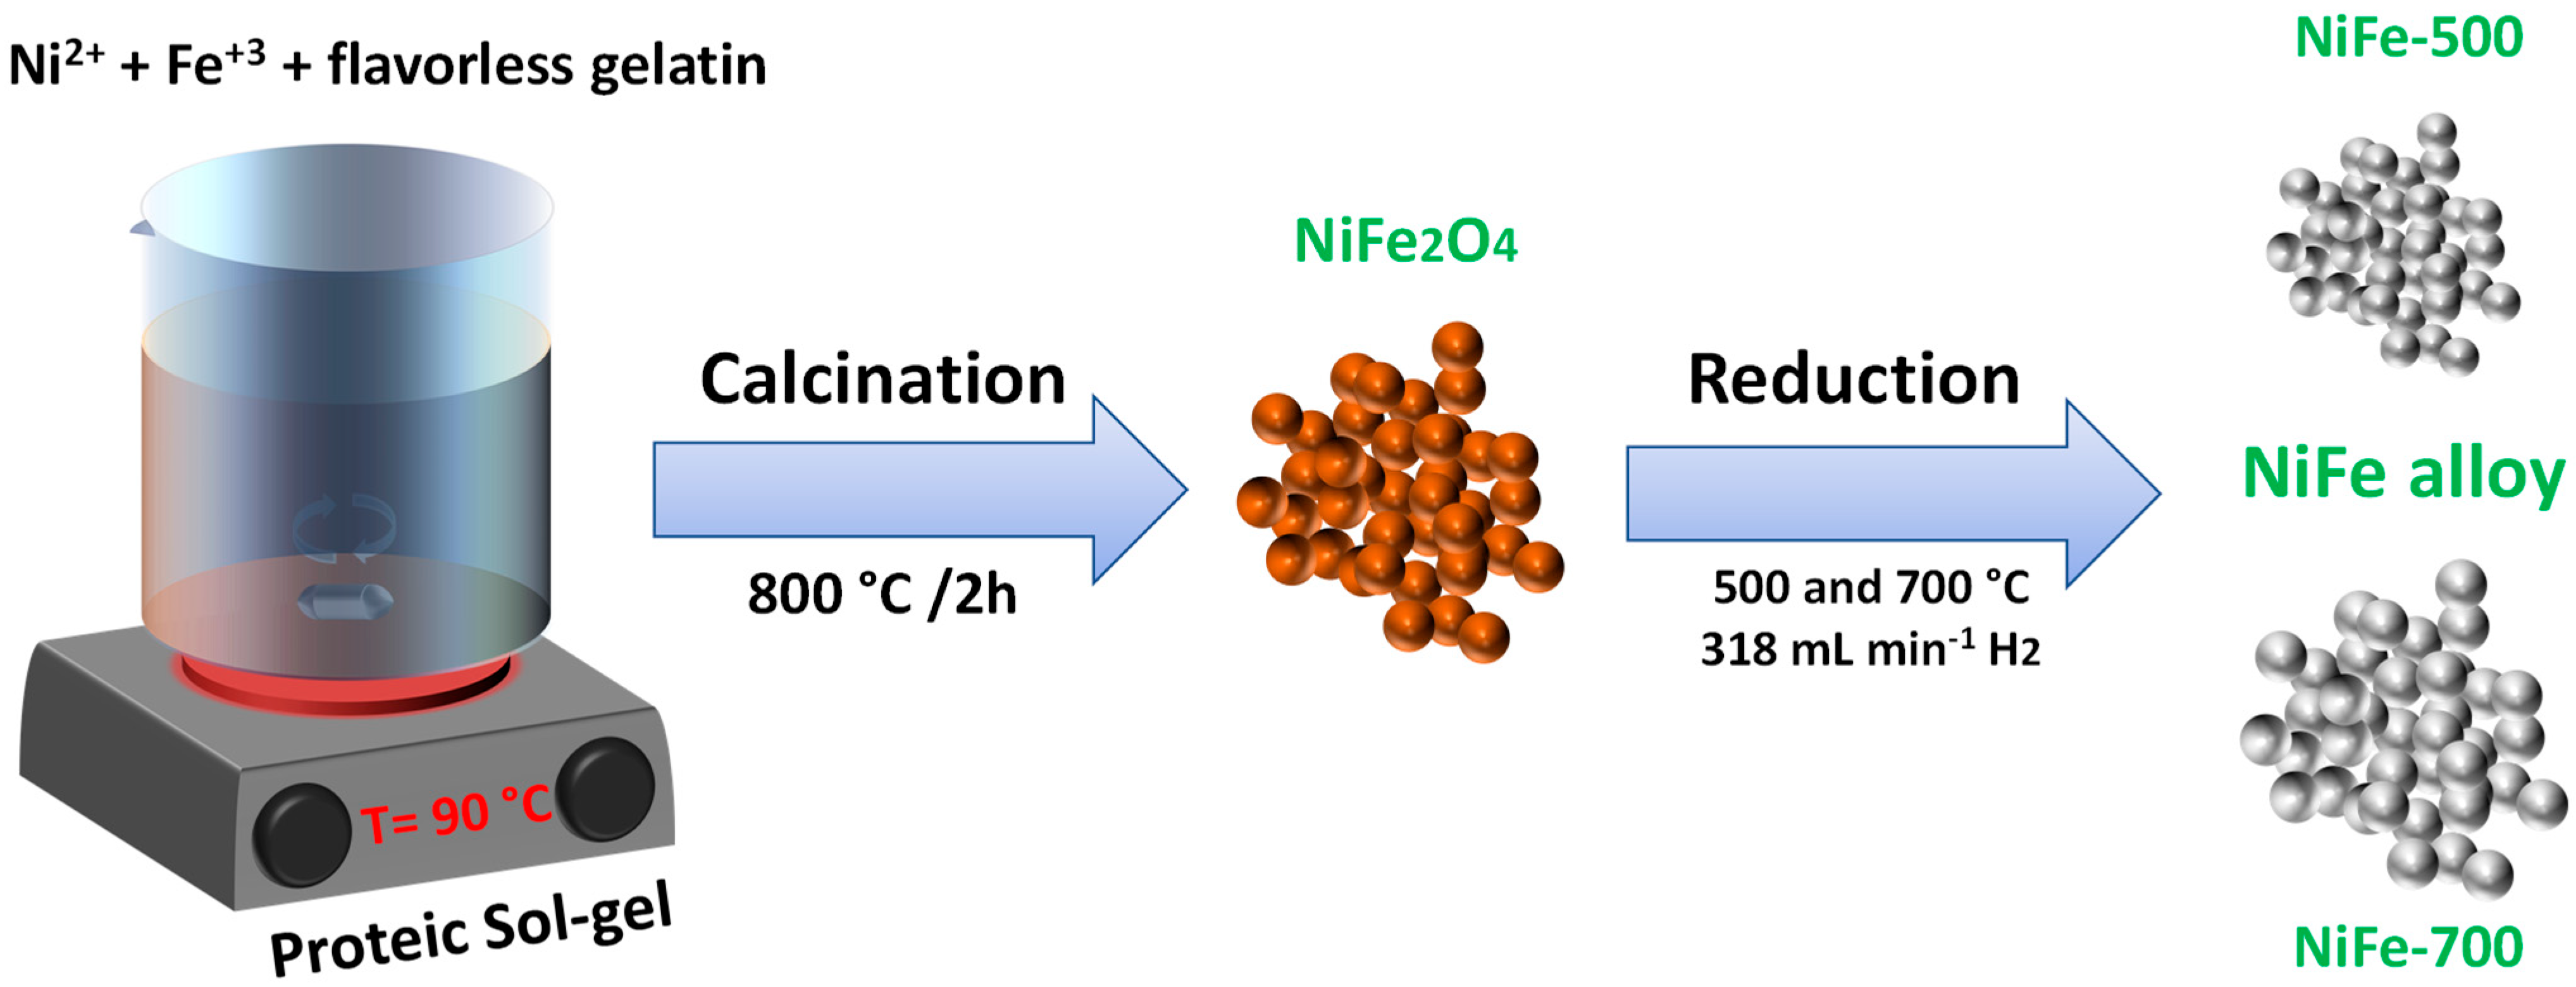
2.1. Preparation of NiFe2O4 Powders and NiFe Alloys
2.2. Structural, Morphological, Chemical, Mössbauer, and Magnetic Characterization
2.3. Electrode Preparation and Electrochemical Characterization
3. Results and Discussion
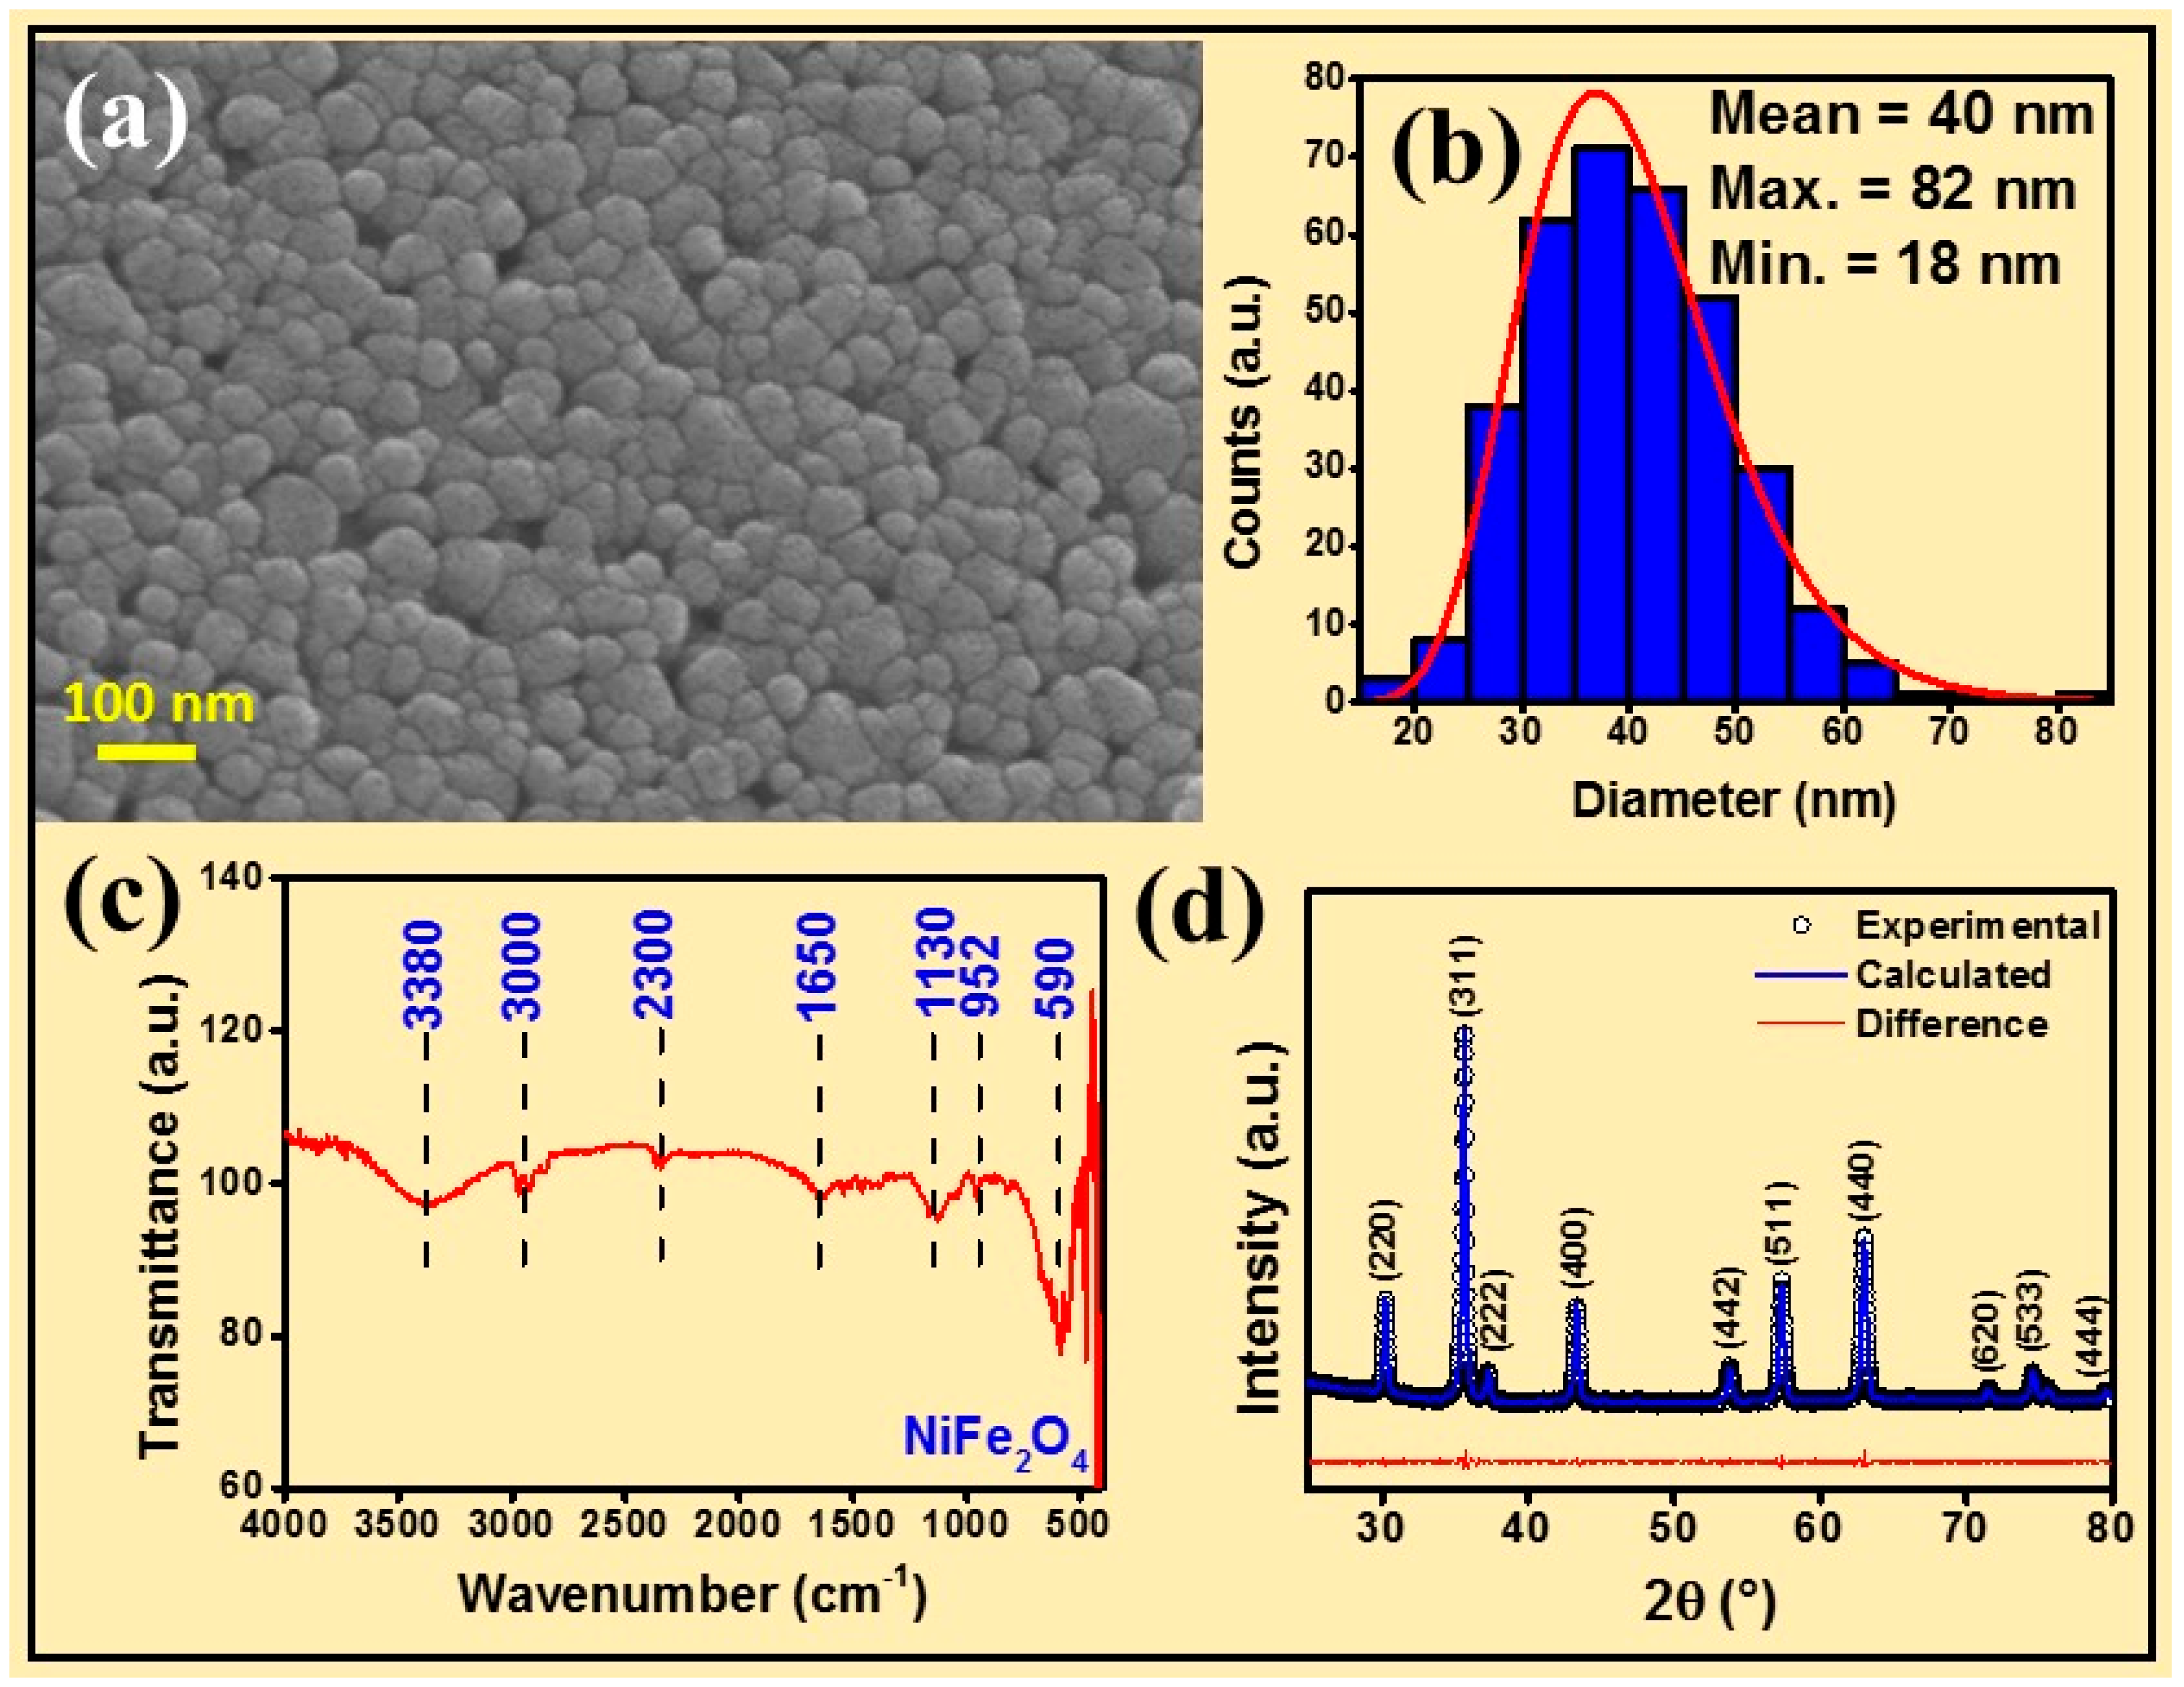
3.1. Characterization of NiFe2O4 Produced by Proteic Sol–Gel Synthesis
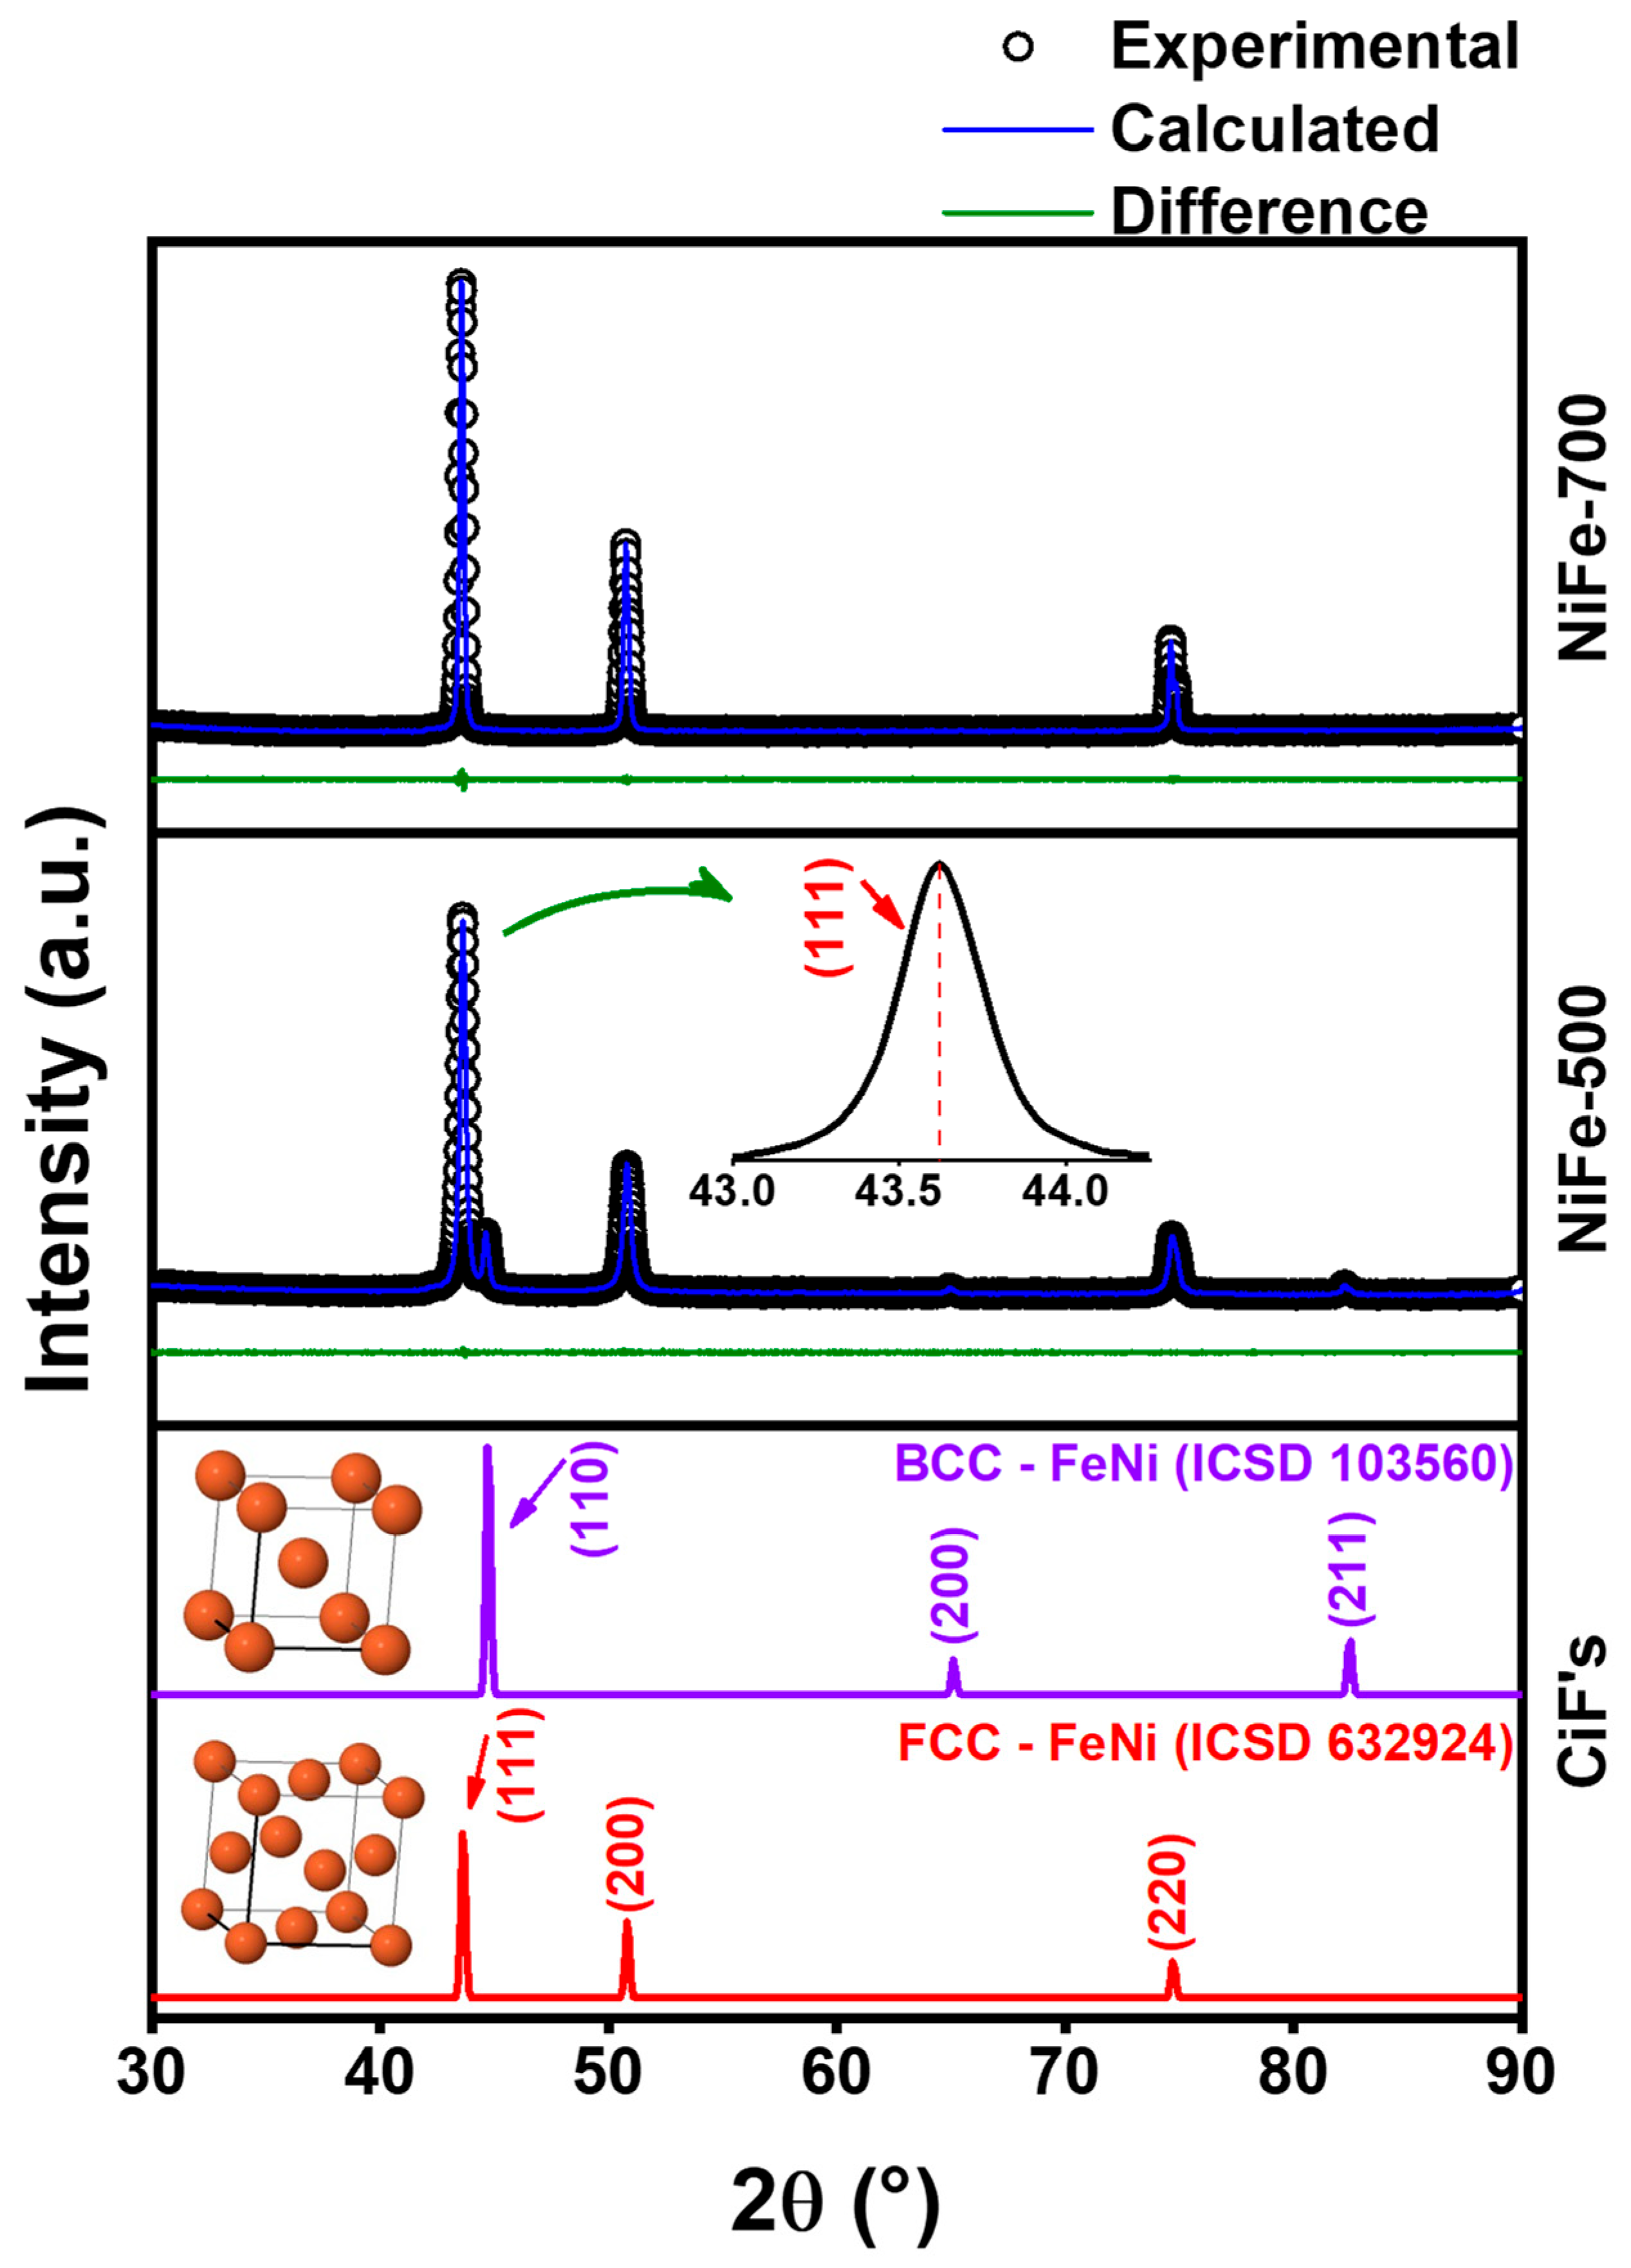
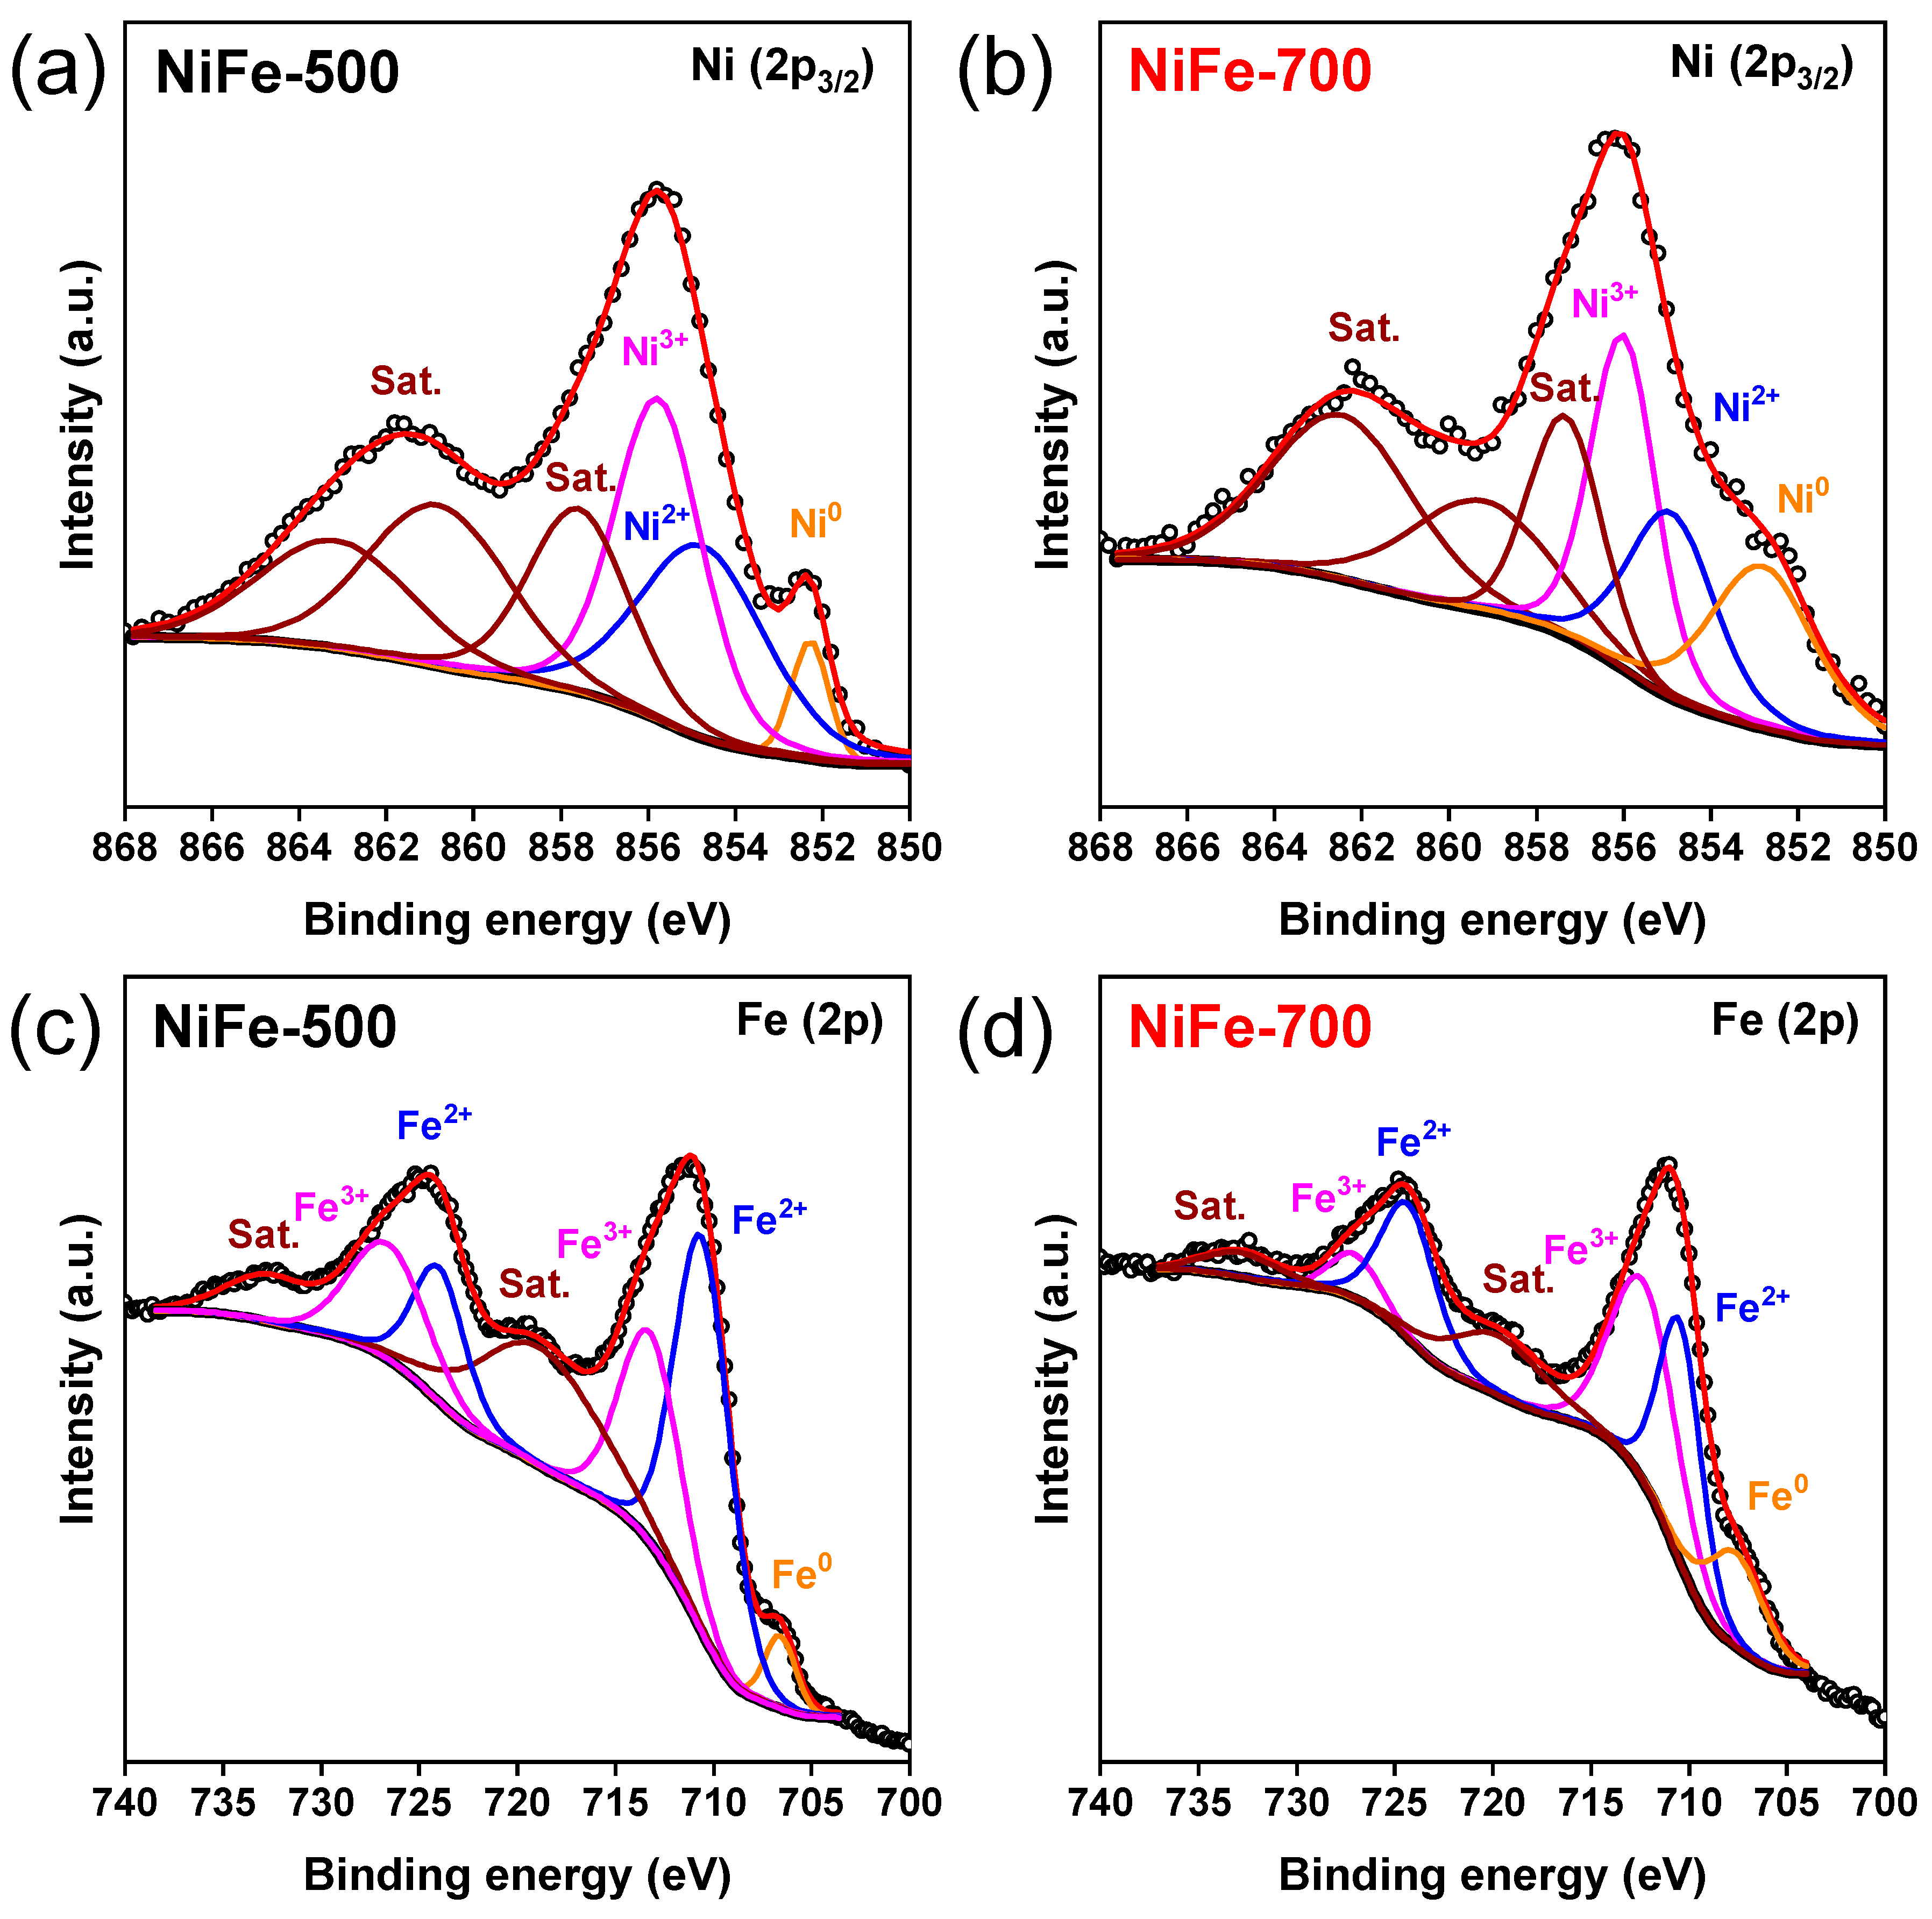
3.2. Structural, Morphological, and Chemical Characterization
3.3. Mössbauer Spectroscopy and Magnetic Properties
3.4. Electrochemistry Characterization
4. Conclusions
Supplementary Materials
Author Contributions
Funding
Institutional Review Board Statement
Informed Consent Statement
Data Availability Statement
Acknowledgments
Conflicts of Interest
References
- Li, H.; Liaw, P.K.; Choo, H.; Tabachnikova, E.D.; Podolskiy, A.V.; Smirnov, S.N.; Bengus, V.Z. Temperature-dependent mechanical behavior of a nanostructured Ni–Fe alloy. Mater. Sci. Eng. A 2008, 493, 93–96. [Google Scholar] [CrossRef]
- Gheisari, K.; Javadpour, S.; Oh, J.; Ghaffari, M. The effect of milling speed on the structural properties of mechanically alloyed Fe–45%Ni powders. J. Alloys Compd. 2009, 472, 416–420. [Google Scholar] [CrossRef]
- Liu, Y.; Qin, M.; Zhang, L.; Huang, M.; Li, S.; Jia, B.; Zhang, D.; Qu, X. Solution combustion synthesis of nanocrystalline Fe–50%Ni alloy powder. Powder Technol. 2014, 267, 68–73. [Google Scholar] [CrossRef]
- Nirouei, M.; Jafari, A.; Boustani, K. Magnetic and Structural Study of FeNi3 Nanoparticles: Effect of Calcination Temperature. J. Supercond. Nov. Magn. 2014, 27, 2803–2811. [Google Scholar] [CrossRef]
- Margeat, O.; Ciuculescu, D.; Lecante, P.; Respaud, M.; Amiens, C.; Chaudret, B. NiFe Nanoparticles: A Soft Magnetic Material? Small 2007, 3, 451–458. [Google Scholar] [CrossRef] [PubMed]
- Veiseh, O.; Gunn, J.W.; Zhang, M. Design and fabrication of magnetic nanoparticles for targeted drug delivery and imaging. Adv. Drug Deliv. Rev. 2010, 62, 284–304. [Google Scholar] [CrossRef] [PubMed]
- Khramtsov, P.; Kropaneva, M.; Byzov, I.; Minin, A.; Mysik, A.; Timganova, V.; Bochkova, M.; Uimin, M.; Zamorina, S.; Yermakov, A.; et al. Conjugation of carbon coated-iron nanoparticles with biomolecules for NMR-based assay. Colloids Surf. B Biointerfaces 2019, 176, 256–264. [Google Scholar] [CrossRef] [PubMed]
- Azizi, A.; Sadrnezhaad, S. Synthesis of Fe–Ni nano-particles by low-temperature hydrogen reduction of mechanically alloyed Ni-ferrite. J. Alloys Compd. 2009, 485, 484–487. [Google Scholar] [CrossRef]
- Abellán, G.; Coronado, E.; Martí-Gastaldo, C.; Ribera, A.; Otero, T.F. Magnetic Nanocomposites Formed by FeNi3 Nanoparticles Embedded in Graphene. Application as Supercapacitors. Part. Part. Syst. Charact. 2013, 30, 853–863. [Google Scholar] [CrossRef]
- Feng, Y.; Qiu, T. Enhancement of electromagnetic and microwave absorbing properties of gas atomized Fe-50wt%Ni alloy by shape modification. J. Magn. Magn. Mater. 2012, 324, 2528–2533. [Google Scholar] [CrossRef]
- Arnold, H.D.; Elmen, G.W. Permalloy, A New Magnetic Material of Very High Permeability. Bell Syst. Tech. J. 1923, 2, 101–111. [Google Scholar] [CrossRef]
- Tabakovic, I.; Inturi, V.; Thurn, J.; Kief, M. Properties of Ni1−xFex (0.1 < x < 0.9) and Invar (x = 0.64) alloys obtained by electrodeposition. Electrochim. Acta 2010, 55, 6749–6754. [Google Scholar] [CrossRef]
- Mccrea, J.L.; Palumbo, G.; Hibbard, G.D.; Erb, U. Properties and applications for electrodeposited nanocrystalline Fe-Ni alloys. Rev. Adv. Mater. Sci. 2003, 5, 252–258. [Google Scholar]
- Heck, D.C. Magnetic Materials and Their Applications; Elsevier: Amsterdam, The Netherlands, 1974; Volume 392. [Google Scholar]
- Liu, Y.; Chi, Y.; Shan, S.; Yin, J.; Luo, J.; Zhong, C.-J. Characterization of magnetic NiFe nanoparticles with controlled bimetallic composition. J. Alloys Compd. 2014, 587, 260–266. [Google Scholar] [CrossRef]
- Dijith, K.S.; Aiswarya, R.; Praveen, M.; Pillai, S.; Surendran, K.P. Polyol derived Ni and NiFe alloys for effective shielding of electromagnetic interference. Mater. Chem. Front. 2018, 2, 1829–1841. [Google Scholar] [CrossRef]
- Yekta, P.V.; Sharifi, E.M.; Ghasemi, A. The effect of thermomechanical treatment on the magnetic and mechanical properties of Fe-48Ni alloy. Phys. B Condens. Matter 2019, 558, 28–37. [Google Scholar] [CrossRef]
- Kurichenko, V.L.; Karpenkov, D.Y.; Karpenkov, A.Y.; Lyakhova, M.B.; Khovaylo, V.V. Synthesis of FeNi tetrataenite phase by means of chemical precipitation. J. Magn. Magn. Mater. 2019, 470, 33–37. [Google Scholar] [CrossRef]
- Singh, N.; Parkash, O.; Kumar, D. Phase evolution, mechanical and corrosion behavior of Fe(100−x) Ni(x) alloys synthesized by powder metallurgy. J. Phys. Chem. Solids 2018, 114, 8–20. [Google Scholar] [CrossRef]
- Bouremana, A.; Guittoum, A.; Hemmous, M.; Martínez-Blanco, D.; Gorria, P.; Blanco, J. Low temperature hydrothermal synthesis of Ni75Fe25 nanostructured powders: Microstructure, morphology and magnetic behaviour. J. Magn. Magn. Mater. 2018, 466, 212–218. [Google Scholar] [CrossRef]
- Zhang, B.; Fenineche, N.-E.; Liao, H.; Coddet, C. Magnetic properties of in-situ synthesized FeNi3 by selective laser melting Fe-80%Ni powders. J. Magn. Magn. Mater. 2013, 336, 49–54. [Google Scholar] [CrossRef]
- Sun, X.; Zhang, X.; Wang, P.; Yang, M.; Ma, J.; Ding, Z.; Geng, B.; Wang, M.; Ma, Y. Evolution of structure and magnetism from NixFe3−xO4 (x = 0, 0.5, 1 and 1.5) to Ni-Fe alloys and to Ni-Fe-N. Mater. Res. Bull. 2017, 95, 261–266. [Google Scholar] [CrossRef]
- Kanhe, N.S.; Kumar, A.; Yusuf, S.M.; Nawale, A.B.; Gaikwad, S.S.; Raut, S.A.; Bhoraskar, S.V.; Wu, S.Y.; Das, A.K.; Mathe, V.L. Investigation of structural and magnetic properties of thermal plasma-synthesized Fe1-xNix alloy nanoparticles. J. Alloys Compd. 2016, 663, 30–40. [Google Scholar] [CrossRef]
- Poroch-Seritan, M.; Cretescu, I.; Cojocaru, C.; Amariei, S.; Suciu, C. Experimental design for modelling and multi-response optimization of Fe–Ni electroplating process. Chem. Eng. Res. Des. 2015, 96, 138–149. [Google Scholar] [CrossRef]
- Raimundo, R.A.; Silva, V.D.; Medeiros, E.S.; Macedo, D.A.; Simões, T.A.; Gomes, U.U.; Morales, M.A.; Gomes, R.M. Multifunctional solution blow spun NiFe–NiFe2O4 composite nanofibers: Structure, magnetic properties and OER activity. J. Phys. Chem. Solids 2020, 139, 109325. [Google Scholar] [CrossRef]
- Xiang, J.; Shen, X.; Song, F.; Liu, M.; Zhou, G.; Chu, Y. Fabrication and characterization of Fe–Ni alloy/nickel ferrite composite nanofibers by electrospinning and partial reduction. Mater. Res. Bull. 2011, 46, 258–261. [Google Scholar] [CrossRef]
- Leite, G.; Chagas, E.; Pereira, R.; Prado, R.; Terezo, A.; Alzamora, M.; Baggio-Saitovitch, E. Exchange coupling behavior in bimagnetic CoFe2O4/CoFe2 nanocomposite. J. Magn. Magn. Mater. 2012, 324, 2711–2716. [Google Scholar] [CrossRef]
- Yourdkhani, A.; Ebrahimi, S.S.; Koohdar, H. Preparation of strontium hexaferrite nano-crystalline powder by carbon monoxide heat treatment and re-calcination from conventionally synthesized powder. J. Alloys Compd. 2009, 470, 561–564. [Google Scholar] [CrossRef]
- Koohdar, H.; Ebrahimi, S.S.; Yourdkhani, A.; Dehghan, R.; Zajkaniha, F. Optimization of hydrogen dynamic heat treatment and re-calcination for preparation of strontium hexaferrite nanocrystalline powder. J. Alloys Compd. 2009, 479, 638–641. [Google Scholar] [CrossRef]
- Hessien, M.; Radwan, M.; Rashad, M. Enhancement of magnetic properties for the barium hexaferrite prepared through ceramic route. J. Anal. Appl. Pyrolysis 2007, 78, 282–287. [Google Scholar] [CrossRef]
- Lima, E.; Drago, V.; Fichtner, P.F.; Domingues, P.H. Tetrataenite and other Fe–Ni equilibrium phases produced by reduction of nanocrystalline NiFe2O4. Solid State Commun. 2003, 128, 345–350. [Google Scholar] [CrossRef]
- Azizi, A.; Yoozbashizadeh, H.; Sadrnezhaad, S. Effect of hydrogen reduction on microstructure and magnetic properties of mechanochemically synthesized Fe–16.5Ni–16.5Co nano-powder. J. Magn. Magn. Mater. 2009, 321, 2729–2732. [Google Scholar] [CrossRef]
- Zhao, Q.; Yan, Z.; Chen, C.; Chen, J. Spinels: Controlled Preparation, Oxygen Reduction/Evolution Reaction Application, and Beyond. Chem. Rev. 2017, 117, 10121–10211. [Google Scholar] [CrossRef]
- Mohammed-Ibrahim, J. A review on NiFe-based electrocatalysts for efficient alkaline oxygen evolution reaction. J. Power Sources 2020, 448, 227375. [Google Scholar] [CrossRef]
- Fan, Z.; Zhang, H. Crystal phase-controlled synthesis, properties and applications of noble metal nanomaterials. Chem. Soc. Rev. 2016, 45, 63–82. [Google Scholar] [CrossRef] [PubMed]
- Wu, Z.-P.; Shan, S.; Xie, Z.-H.; Kang, N.; Park, K.; Hopkins, E.; Yan, S.; Sharma, A.; Luo, J.; Wang, J.; et al. Revealing the Role of Phase Structures of Bimetallic Nanocatalysts in the Oxygen Reduction Reaction. ACS Catal. 2018, 8, 11302–11313. [Google Scholar] [CrossRef]
- Wang, C.; Yang, H.; Zhang, Y.; Wang, Q. NiFe Alloy Nanoparticles with hcp Crystal Structure Stimulate Superior Oxygen Evolution Reaction Electrocatalytic Activity. Angew. Chem. 2019, 131, 6160–6164. [Google Scholar] [CrossRef]
- Gu, J.; Guo, Y.; Jiang, Y.-Y.; Zhu, W.; Xu, Y.-S.; Zhao, Z.-Q.; Liu, J.-X.; Li, W.-X.; Jin, C.-H.; Yan, C.-H.; et al. Robust Phase Control through Hetero-Seeded Epitaxial Growth for Face-Centered Cubic [email protected] Nanotetrahedrons with Superior Hydrogen Electro-Oxidation Activity. J. Phys. Chem. C 2015, 119, 17697–17706. [Google Scholar] [CrossRef]
- Kim, J.; Lee, Y.; Sun, S. Structurally Ordered FePt Nanoparticles and Their Enhanced Catalysis for Oxygen Reduction Reaction. J. Am. Chem. Soc. 2010, 132, 4996–4997. [Google Scholar] [CrossRef]
- Vo, T.-G.; Hidalgo, S.D.S.; Chiang, C.-Y. Controllable electrodeposition of binary metal films from deep eutectic solvent as an efficient and durable catalyst for the oxygen evolution reaction. Dalton Trans. 2019, 48, 14748–14757. [Google Scholar] [CrossRef]
- Liang, Y.; Liu, Q.; Asiri, A.M.; Sun, X.; He, Y. Nickel–iron foam as a three-dimensional robust oxygen evolution electrode with high activity. Int. J. Hydrog. Energy 2015, 40, 13258–13263. [Google Scholar] [CrossRef]
- Biset-Peiró, M.; Murcia-López, S.; Fabrega, C.; Morante, J.-R.; Andreu, T. Multilayer Ni/Fe thin films as oxygen evolution catalysts for solar fuel production. J. Phys. D Appl. Phys. 2017, 50, 104003. [Google Scholar] [CrossRef]
- Lima, C.G.; Silva, R.M.; Aquino, F.D.M.; Raveau, B.; Caignaert, V.; Cesário, M.R.; Macedo, D.A. Proteic sol-gel synthesis of copper doped misfit Ca-cobaltites with potential SOFC application. Mater. Chem. Phys. 2017, 187, 177–182. [Google Scholar] [CrossRef]
- Silva, R.M.; Raimundo, R.A.; Fernandes, W.V.; Torres, S.M.; Silva, V.D.; Grilo, J.P.; Morales, M.A.; Macedo, D.A. Proteic sol-gel synthesis, structure and magnetic properties of Ni/NiO core-shell powders. Ceram. Int. 2018, 44, 6152–6156. [Google Scholar] [CrossRef]
- Santos, J.R.; Loureiro, F.J.; Grilo, J.P.; Silva, V.D.; Simões, T.A.; Fagg, D.P.; Macedo, D.A. Understanding the cathodic polarisation behaviour of the misfit [Ca2CoO3−δ]q[CoO2] (C349) as oxygen electrode for IT-SOFC. Electrochim. Acta 2018, 285, 214–220. [Google Scholar] [CrossRef]
- Schneider, C.A.; Rasband, W.S.; Eliceiri, K.W. NIH Image to ImageJ: 25 Years of image analysis. Nat. Methods 2012, 9, 671–675. [Google Scholar] [CrossRef] [PubMed]
- Bruker, A.X.S. TOPAS V4: General Profile and Structure Analysis Software for Powder Diffraction Data; User’s Manual; Bruker AXS: Karlsruhe, Germany, 2009; Volume 72. [Google Scholar]
- Brand, R.A. Normos Programs, Normos Mössbauer Fitting Program; University of Duisburg: Duisburg, Germany, 2002. [Google Scholar]
- Gorter, E.W. Saturation Magnetization and Crystal Chemistry of Ferrimagnetic Oxides. 1954. Available online: https://www.lorentz.leidenuniv.nl/history/proefschriften/sources/Gorter_1954.pdf (accessed on 1 August 2023).
- Ono, F.; Kittaka, T.; Maeta, H. Thermal expansion measurements in Fe-base invar alloys. Phys. B+C 1983, 119, 78–83. [Google Scholar] [CrossRef]
- Chaudhuri, D.K.; Ravindran, P.A.; Wert, J.J. Comparative X-ray Diffraction and Electron Microscopic Study of the Transformation-Induced Substructures in the Iron-Nickel Martensites and Their Influence on the Martensite Properties. J. Appl. Phys. 1972, 43, 778–788. [Google Scholar] [CrossRef]
- Lim, D.; Oh, E.; Lim, C.; Shim, S.E.; Baeck, S.-H. Bimetallic NiFe alloys as highly efficient electrocatalysts for the oxygen evolution reaction. Catal. Today 2019, 352, 27–33. [Google Scholar] [CrossRef]
- Swartzendruber, L.J.; Itkin, V.P.; Alcock, C.B. The Fe-Ni (iron-nickel) system. J. Phase Equilibria Diffus. 1991, 12, 288–312. [Google Scholar] [CrossRef]
- Yang, C.W.; Williams, D.B.; Goldstein, J.I. A revision of the Fe-Ni phase diagram at low temperatures (<400 °C). J. Phase Equilibria Diffus. 1996, 17, 522–531. [Google Scholar] [CrossRef]
- Kubaschewski, O. Iron-Binary Phase Diagrams; Springer: Berlin/Heidelberg, Germany, 1982. [Google Scholar] [CrossRef]
- Kurlyandskaya, G.; Bhagat, S.; Bagazeev, A.; Medvedev, A.; Ballesteros, A.; Beketov, I.; Safronov, A. Structure, magnetic and microwave properties of FeNi invar nanoparticles obtained by electrical explosion of wire in different preparation conditions. J. Phys. Chem. Solids 2016, 98, 255–262. [Google Scholar] [CrossRef]
- Ping, T.; Das, T.K.; Jena, B.K. In-situ construction of porous Fe/Ni/Co-phosphide heterostructures with electron redistribution for the efficient water oxidation reaction. Electrochim. Acta 2023, 459, 142504–142514. [Google Scholar] [CrossRef]
- Feng, B.; Hao, Y.; Chen, J.; Wang, H.; Zhong, C.; Yang, Y.; Yao, Y. Nanostructured NiFe (oxy)hydroxide fabricated on nickel foams by laser-induced water plasma for enhanced alkaline oxygen evolution reaction. Appl. Surf. Sci. 2023, 622, 156934–156943. [Google Scholar] [CrossRef]
- Biesinger, M.C.; Payne, B.P.; Lau, L.W.M.; Gerson, A.; Smart, R.S.C. X-ray photoelectron spectroscopic chemical state quantification of mixed nickel metal, oxide and hydroxide systems. Surf. Interface Anal. 2009, 41, 324–332. [Google Scholar] [CrossRef]
- Grosvenor, A.P.; Biesinger, M.C.; Smart, R.S.C.; McIntyre, N.S. New interpretations of XPS spectra of nickel metal and oxides. Surf. Sci. 2006, 600, 1771–1779. [Google Scholar] [CrossRef]
- Nardi, K.L.; Yang, N.; Dickens, C.F.; Strickler, A.L.; Bent, S.F. Creating Highly Active Atomic Layer Deposited NiO Electrocatalysts for the Oxygen Evolution Reaction. Adv. Energy Mater. 2015, 5, 1500412. [Google Scholar] [CrossRef]
- Silva, V.D.; Simões, T.A.; Loureiro, F.J.; Fagg, D.P.; Figueiredo, F.M.; Medeiros, E.S.; Macedo, D.A. Solution blow spun nickel oxide/carbon nanocomposite hollow fibres as an efficient oxygen evolution reaction electrocatalyst. Int. J. Hydrog. Energy 2019, 44, 14877–14888. [Google Scholar] [CrossRef]
- Loureiro, F.J.; Souza, G.S.; Graca, V.; Araújo, A.; Grilo, J.P.D.F.; Macedo, D.; Fagg, D.P. Nickel-copper based anodes for solid oxide fuel cells running on hydrogen and biogas: Study using ceria-based electrolytes with electronic short-circuiting correction. J. Power Sources 2019, 438, 227041. [Google Scholar] [CrossRef]
- Hoang, T.T.H.; Gewirth, A.A. High Activity Oxygen Evolution Reaction Catalysts from Additive Controlled Electrodeposited Ni and NiFe Films. ACS Catal. 2016, 6, 1159–1164. [Google Scholar] [CrossRef]
- Bandal, H.A.; Jadhav, A.R.; Kim, H. Facile synthesis of bicontinuous Ni3Fe alloy for efficient electrocatalytic oxygen evolution reaction. J. Alloys Compd. 2017, 726, 875–884. [Google Scholar] [CrossRef]
- Franco, H.; Rechenberg, H.R. A Mossbauer study of the miscibility gap in iron-nickel Invar alloys. J. Phys. F Met. Phys. 1985, 15, 719–725. [Google Scholar] [CrossRef]
- Ping, J.; Rancourt, D.; Dunlap, R. Physical basis and break down of hyperfine field distribution analysis in fcc Fe-Ni (5–70 at%Fe). J. Magn. Magn. Mater. 1992, 103, 285–313. [Google Scholar] [CrossRef]
- Valderruten, J.; Alcazar, G.P.; Greneche, J. Study of Fe–Ni alloys produced by mechanical alloying. Phys. B Condens. Matter 2006, 384, 316–318. [Google Scholar] [CrossRef]
- Arajs, S.; Miller, D.S. Paramagnetic Susceptibilities of Fe and Fe-Si Alloys. J. Appl. Phys. 1960, 31, 986–991. [Google Scholar] [CrossRef]
- Keune, W.; Halbauer, R.; Gonser, U.; Lauer, J.; Williamson, D.L. Antiferromagnetism of fcc Fe thin films. J. Appl. Phys. 1977, 48, 2976–2979. [Google Scholar] [CrossRef]
- Rodríguez, E.D.B.; Rodríguez, H.B.; Lozano, D.O.; Martínez, Y.A.R.; Alcázar, G.A.P. Mössbauer study of alloy Fe67.5Ni32.5, prepared by mechanical alloying. Hyperfine Interact. 2015, 232, 87–95. [Google Scholar] [CrossRef]
- Yang, J.; Goldstein, J.I. Magnetic contribution to the interdiffusion coefficients in bcc (α) and fcc (γ) Fe-Ni alloys. Met. Mater. Trans. A 2004, 35, 1681–1690. [Google Scholar] [CrossRef]
- Öner, Y.; Guler, A. Evidence of a Griffiths phase in a mixed compound of YFe2 and YFe3. J. Appl. Phys. 2013, 113, 17E141. [Google Scholar] [CrossRef]
- Ubaid-Kassis, S.; Vojta, T.; Schroeder, A. Quantum Griffiths Phase in the Weak Itinerant Ferromagnetic AlloyNi1−xVx. Phys. Rev. Lett. 2010, 104, 066402. [Google Scholar] [CrossRef] [PubMed]
- Araújo-Barbosa, S.; Morales, M.A. Nanoparticles of Ni1−Cu alloys for enhanced heating in magnetic hyperthermia. J. Alloys Compd. 2019, 787, 935–943. [Google Scholar] [CrossRef]
- Cullity, B.D.; Graham, C.D. Introduction to Magnetic Materials, 2nd ed.; John Wiley & Sons, Inc.: Hoboken, NJ, USA, 2009. [Google Scholar]
- Lourenço, A.D.A.; Silva, V.D.; da Silva, R.B.; Silva, U.C.; Chesman, C.; Salvador, C.; Simões, T.A.; de Macedo, D.A.; da Silva, F.F. Metal-organic frameworks as template for synthesis of Mn3+/Mn4+ mixed valence manganese cobaltites electrocatalysts for oxygen evolution reaction. J. Colloid Interface Sci. 2021, 582, 124–136. [Google Scholar] [CrossRef] [PubMed]
- Lian, J.; Wu, Y.; Zhang, H.; Gu, S.; Zeng, Z.; Ye, X. One-step synthesis of amorphous Ni–Fe–P alloy as bifunctional electrocatalyst for overall water splitting in alkaline medium. Int. J. Hydrog. Energy 2018, 43, 12929–12938. [Google Scholar] [CrossRef]
- Jia, D.; Gao, H.; Zhao, J.; Xing, L.; Chen, X.; Huang, X.; Dang, R.; Wang, G. Self-templating synthesis of hollow NiFe hydroxide nanospheres for efficient oxygen evolution reaction. Electrochim. Acta 2020, 357, 136869. [Google Scholar] [CrossRef]
- Silva, V.D.; Ferreira, L.S.; Simões, T.A.; Medeiros, E.S.; Macedo, D.A. 1D hollow MFe2O4 (M = Cu, Co, Ni) fibers by Solution Blow Spinning for oxygen evolution reaction. J. Colloid Interface Sci. 2019, 540, 59–65. [Google Scholar] [CrossRef]
- Lv, Y.; Batool, A.; Wei, Y.; Xin, Q.; Boddula, R.; Jan, S.U.; Akram, M.Z.; Tian, L.; Guo, B.; Gong, J.R. Homogeneously Distributed NiFe Alloy Nanoparticles on 3D Carbon Fiber Network as a Bifunctional Electrocatalyst for Overall Water Splitting. ChemElectroChem 2019, 6, 2497–2502. [Google Scholar] [CrossRef]
- Anantharaj, S.; Ede, S.R.; Karthick, K.; Sankar, S.S.; Sangeetha, K.; Karthik, P.E.; Kundu, S. Precision and correctness in the evaluation of electrocatalytic water splitting: Revisiting activity parameters with a critical assessment. Energy Environ. Sci. 2018, 11, 744–771. [Google Scholar] [CrossRef]
- McCrory, C.C.L.; Jung, S.; Peters, J.C.; Jaramillo, T.F. Benchmarking Heterogeneous Electrocatalysts for the Oxygen Evolution Reaction. J. Am. Chem. Soc. 2013, 135, 16977–16987. [Google Scholar] [CrossRef]
- Wang, J.; Gan, L.; Zhang, W.; Peng, Y.; Yu, H.; Yan, Q.; Xia, X.; Wang, X. In situ formation of molecular Ni-Fe active sites on heteroatom-doped graphene as a heterogeneous electrocatalyst toward oxygen evolution. Sci. Adv. 2018, 4, eaap7970. [Google Scholar] [CrossRef]
- Song, F.; Hu, X. Exfoliation of layered double hydroxides for enhanced oxygen evolution catalysis. Nat. Commun. 2014, 5, 4477. [Google Scholar] [CrossRef]
- Qi, J.; Zhang, W.; Xiang, R.; Liu, K.; Wang, H.; Chen, M.; Han, Y.; Cao, R. Porous Nickel–Iron Oxide as a Highly Efficient Electrocatalyst for Oxygen Evolution Reaction. Adv. Sci. 2015, 2, 1500199. [Google Scholar] [CrossRef]
- Yu, X.; Zhang, M.; Yuan, W.; Shi, G. A high-performance three-dimensional Ni–Fe layered double hydroxide/graphene electrode for water oxidation. J. Mater. Chem. A 2015, 3, 6921–6928. [Google Scholar] [CrossRef]
- Zhang, X.; Xu, H.; Li, X.; Li, Y.; Yang, T.; Liang, Y. Facile Synthesis of Nickel–Iron/Nanocarbon Hybrids as Advanced Electrocatalysts for Efficient Water Splitting. ACS Catal. 2016, 6, 580–588. [Google Scholar] [CrossRef]
- Wu, L.-K.; Zhu, Y.-X.; Liu, M.; Hou, G.-Y.; Tang, Y.-P.; Cao, H.-Z.; Zhang, H.-B.; Zheng, G.-Q. Ultrafast fabrication of amorphous bimetallic hydroxide layer on nickel nanocones array for oxygen evolution electrocatalyst. Int. J. Hydrog. Energy 2019, 44, 5899–5911. [Google Scholar] [CrossRef]
- Gao, X.; Long, X.; Yu, H.; Pan, X.; Yi, Z. Ni Nanoparticles Decorated NiFe Layered Double Hydroxide as Bifunctional Electrochemical Catalyst. J. Electrochem. Soc. 2017, 164, H307–H310. [Google Scholar] [CrossRef]
- Si, S.; Hu, H.-S.; Liu, R.-J.; Xu, Z.-X.; Wang, C.-B.; Feng, Y.-Y. Co–NiFe layered double hydroxide nanosheets as an efficient electrocatalyst for the electrochemical evolution of oxygen. Int. J. Hydrog. Energy 2020, 45, 9368–9379. [Google Scholar] [CrossRef]
- Liu, Z.; Tang, B.; Gu, X.; Liu, H.; Feng, L. Selective structure transformation for NiFe/NiFe2O4 embedded porous nitrogen-doped carbon nanosphere with improved oxygen evolution reaction activity. Chem. Eng. J. 2020, 395, 125170. [Google Scholar] [CrossRef]
- Hu, J.; Zhu, S.; Liang, Y.; Wu, S.; Li, Z.; Luo, S.; Cui, Z. Self-supported Ni3Se2@NiFe layered double hydroxide bifunctional electrocatalyst for overall water splitting. J. Colloid Interface Sci. 2021, 587, 79–89. [Google Scholar] [CrossRef]
- Li, S.; Liu, J.; Duan, S.; Wang, T.; Li, Q. Tuning the oxygen evolution electrocatalysis on NiFe-layered double hydroxides via sulfur doping. Chin. J. Catal. 2020, 41, 847–852. [Google Scholar] [CrossRef]
- Ferreira, L.S.; Silva, T.R.; Santos, J.R.; Silva, V.D.; Raimundo, R.A.; Morales, M.A.; Macedo, D.A. Structure, magnetic behavior and OER activity of CoFe2O4 powders obtained using agar-agar from red seaweed (Rhodophyta). Mater. Chem. Phys. 2019, 237, 121847. [Google Scholar] [CrossRef]
- Swierk, J.R.; Klaus, S.; Trotochaud, L.; Bell, A.T.; Tilley, T.D. Electrochemical Study of the Energetics of the Oxygen Evolution Reaction at Nickel Iron (Oxy)Hydroxide Catalysts. J. Phys. Chem. C 2015, 119, 19022–19029. [Google Scholar] [CrossRef]


| Sample | NiFe-FCC (632924) | NiFe-BCC (103560) | Agreement Factors | ||||
|---|---|---|---|---|---|---|---|
| DXRD (nm) | a (Å) | DXRD (nm) | a (Å) | Rwp (%) | Rexp (%) | χ2 | |
| Ni34Fe66-(FCC)—ICSD 632924 | --------- | 3.5928 | --------- | --------- | --------- | --------- | --------- |
| NiFe-(BCC)—ICSD 103560 | --------- | --------- | --------- | 2.8650 | --------- | --------- | --------- |
| NiFe-500 | 37 [93 wt%] | 3.5906 | 60 [7 wt%] | 2.8685 | 4.26 | 3.78 | 1.13 |
| NiFe-700 | 52 [100 wt%] | 3.5912 | --------- | --------- | 3.95 | 3.22 | 1.23 |
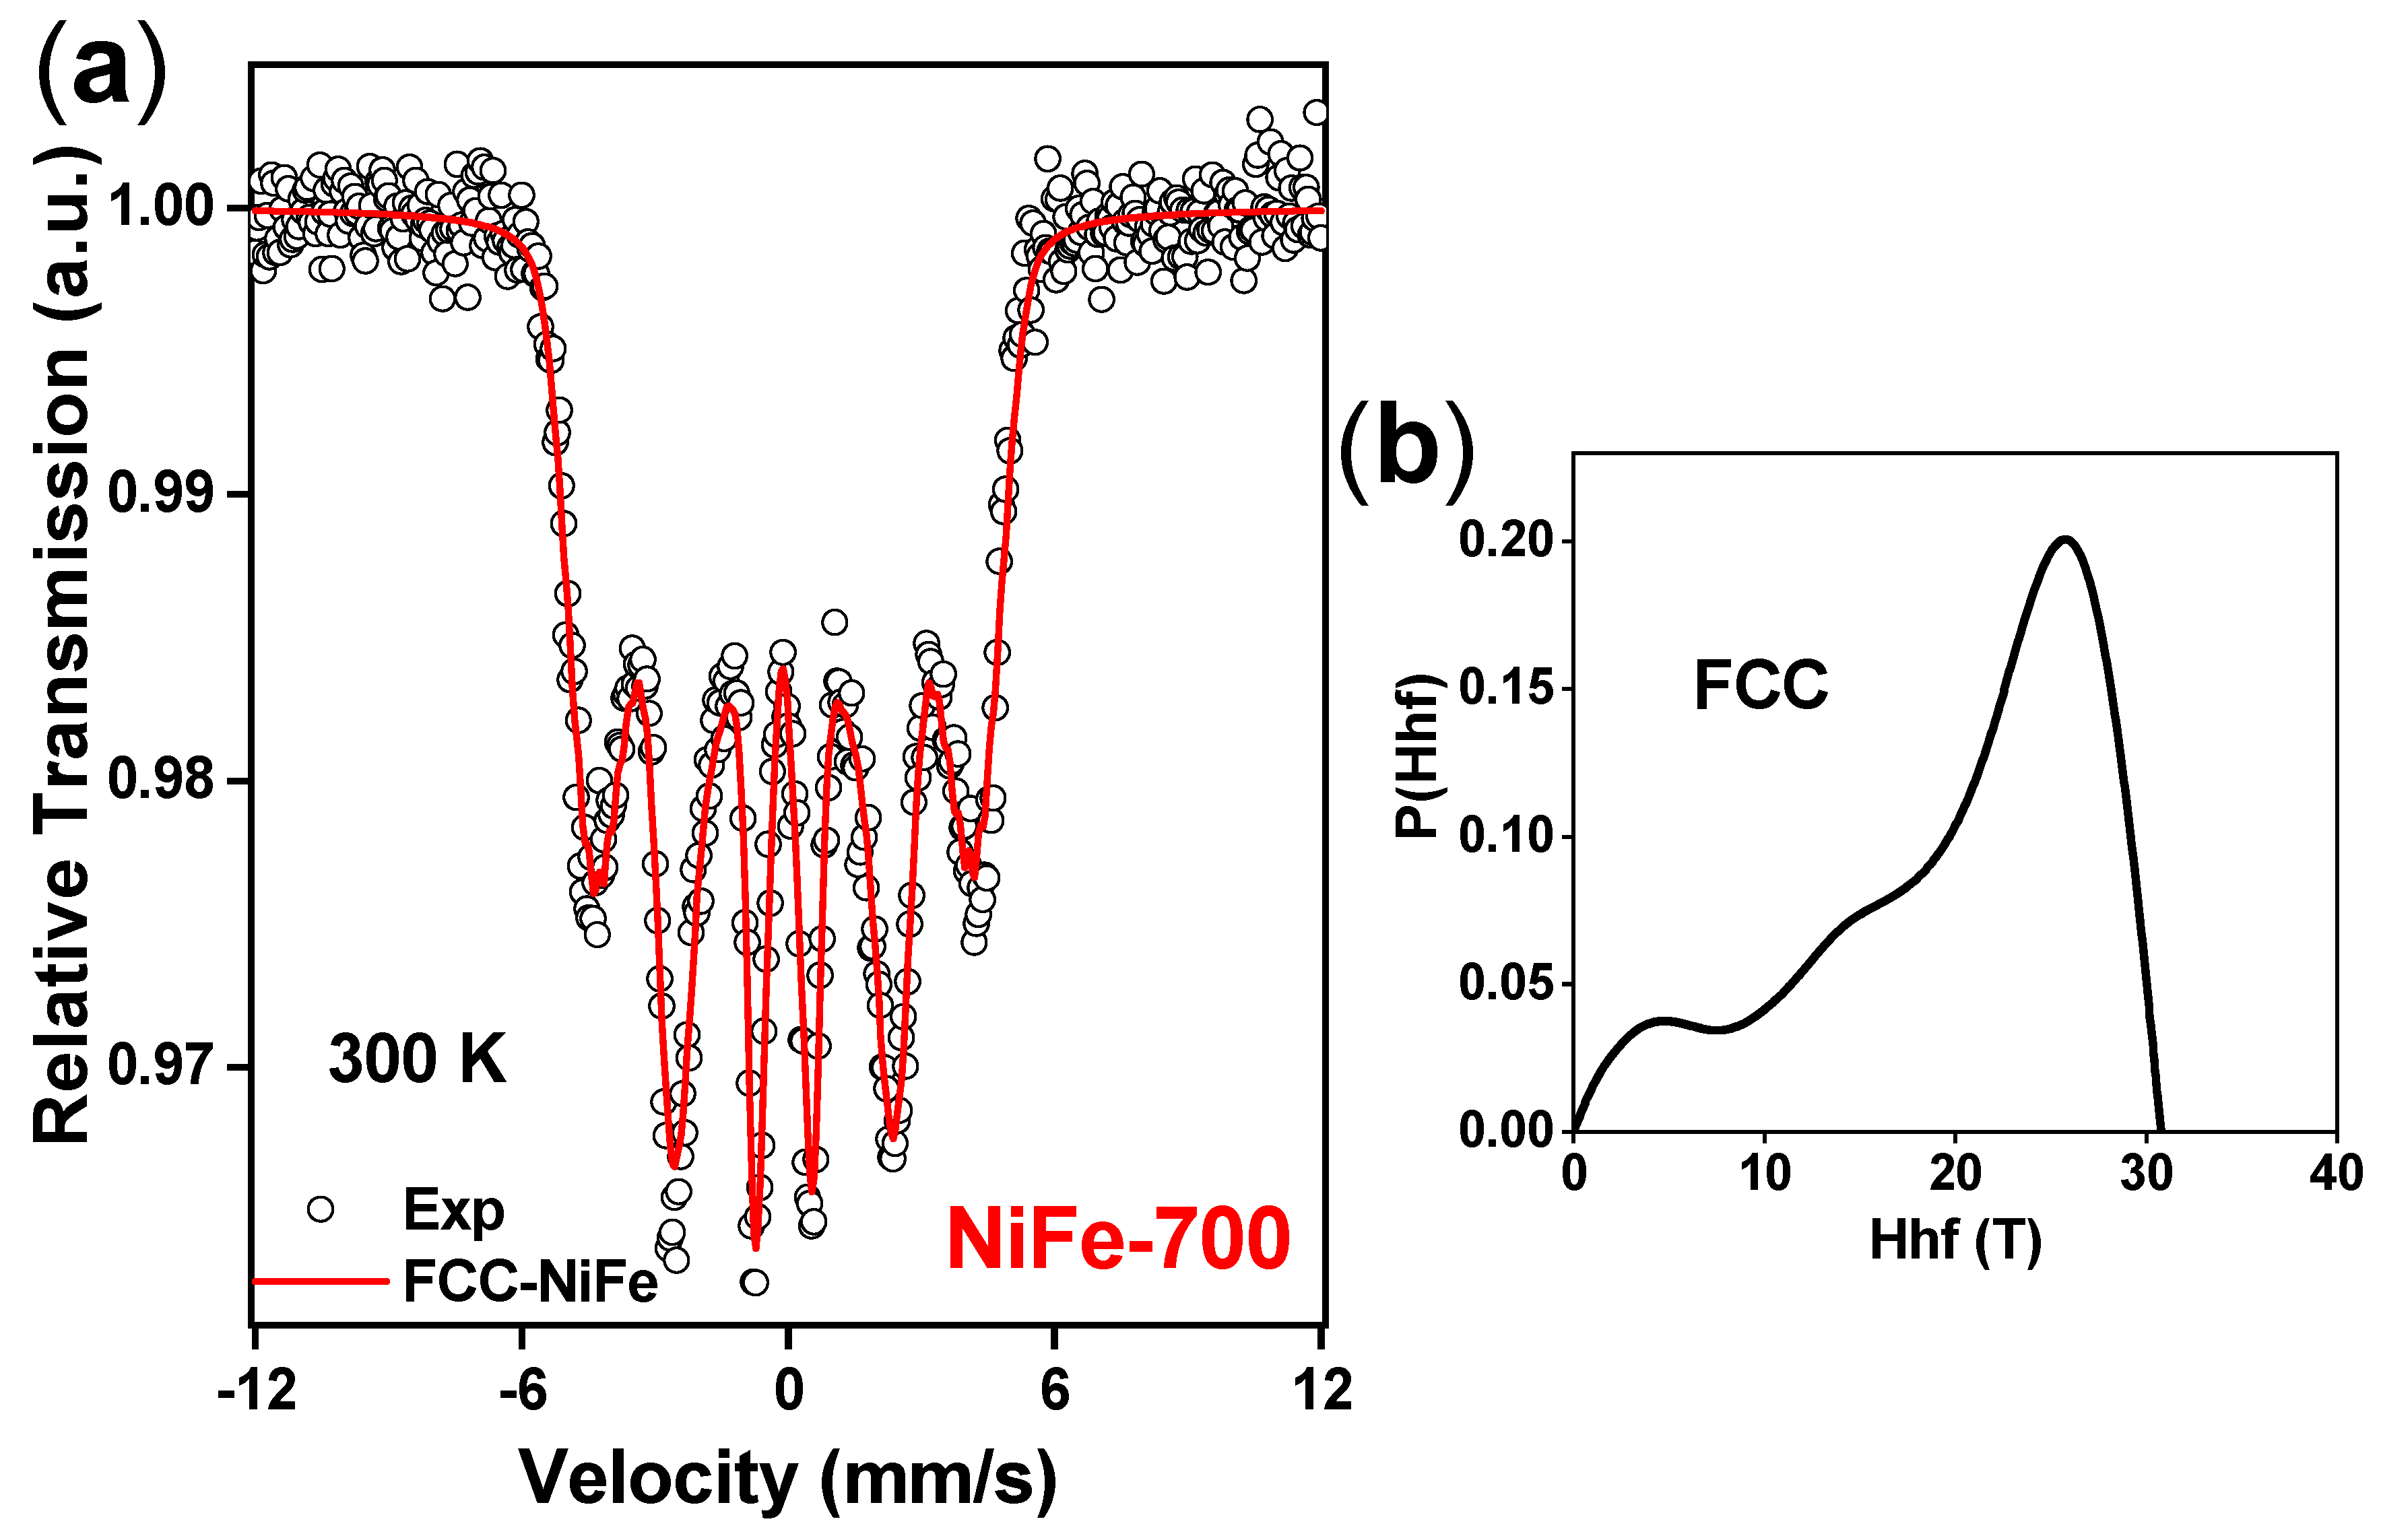
| Sample | Site | IS (mm/s) | Hhf (T) | Qs (mm/s) | RAA (%) |
|---|---|---|---|---|---|
| NiFe–500 | Fe in FCC | 0.042 | 27.5 | −0.005 | 85 |
| Fe in BCC | 0.068 | 33.5 | −0.022 | 7 | |
| Fe in PM | <0.035> | - | - | 8 | |
| NiFe–700 | Fe in FCC | 0.021 | 26.5 | - | 100 |
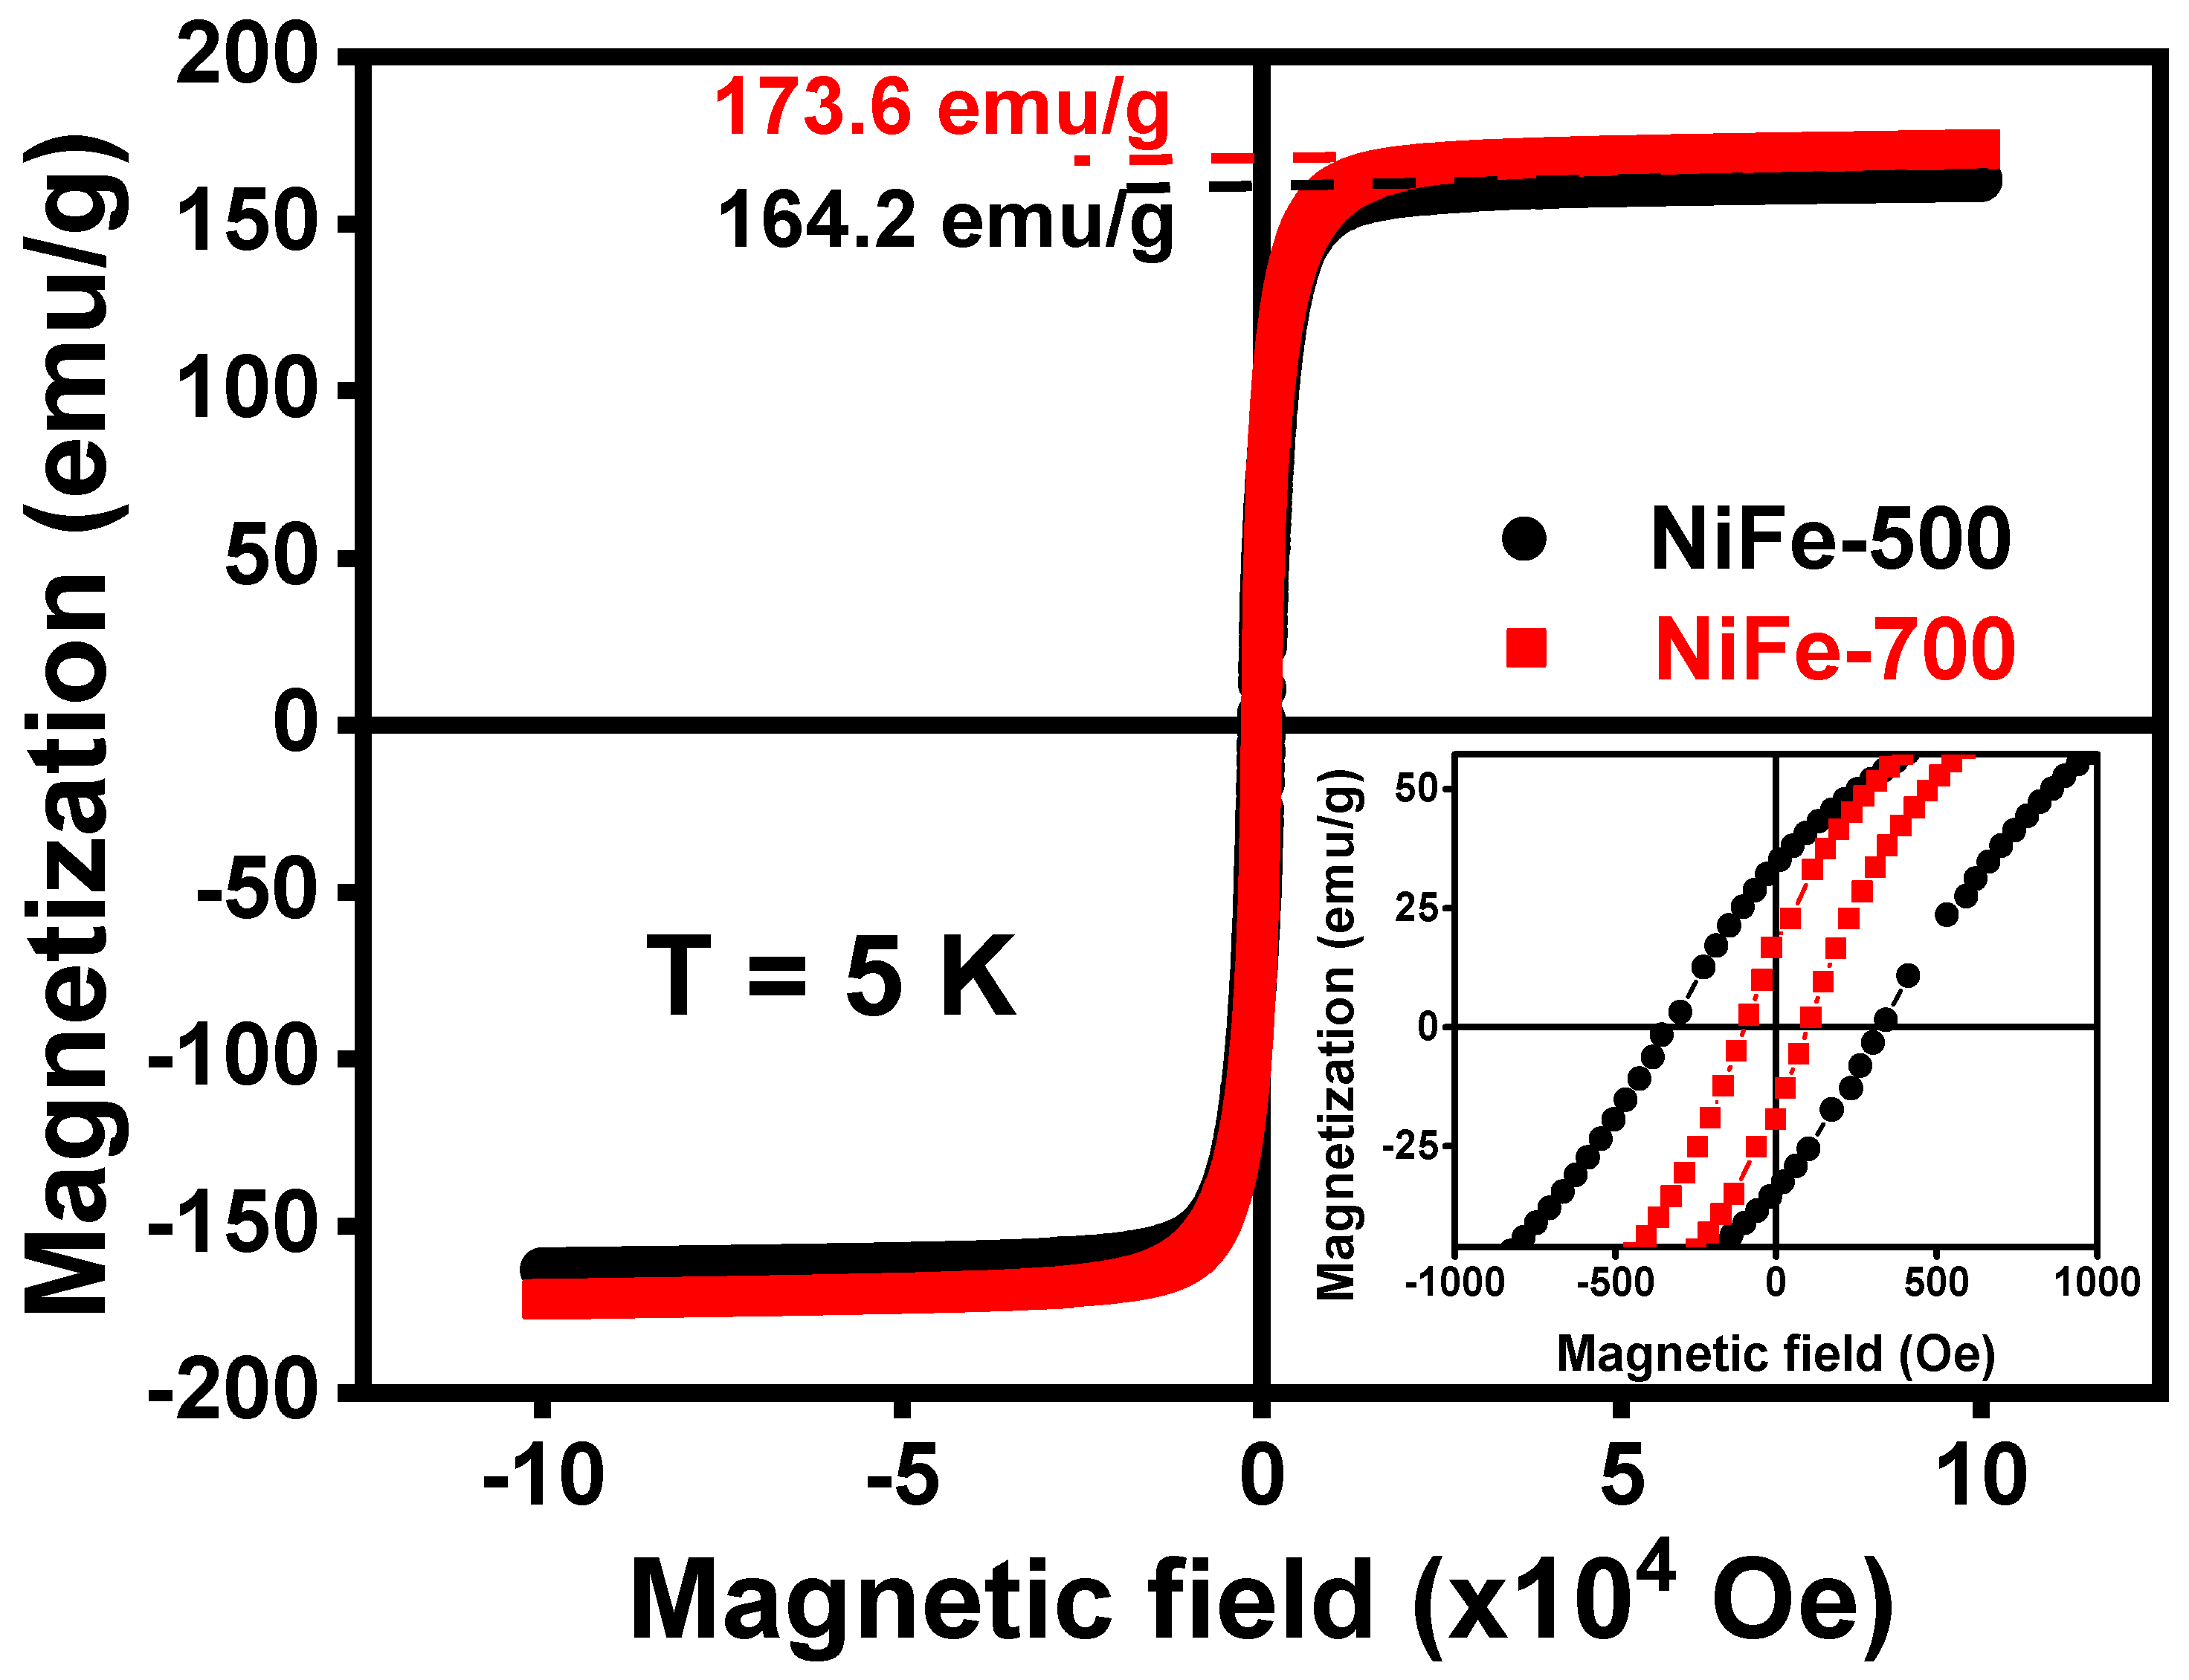
| Sample | Ms (emu/g) | Mr (emu/g) | Mr/Ms | Hc (Oe) |
|---|---|---|---|---|
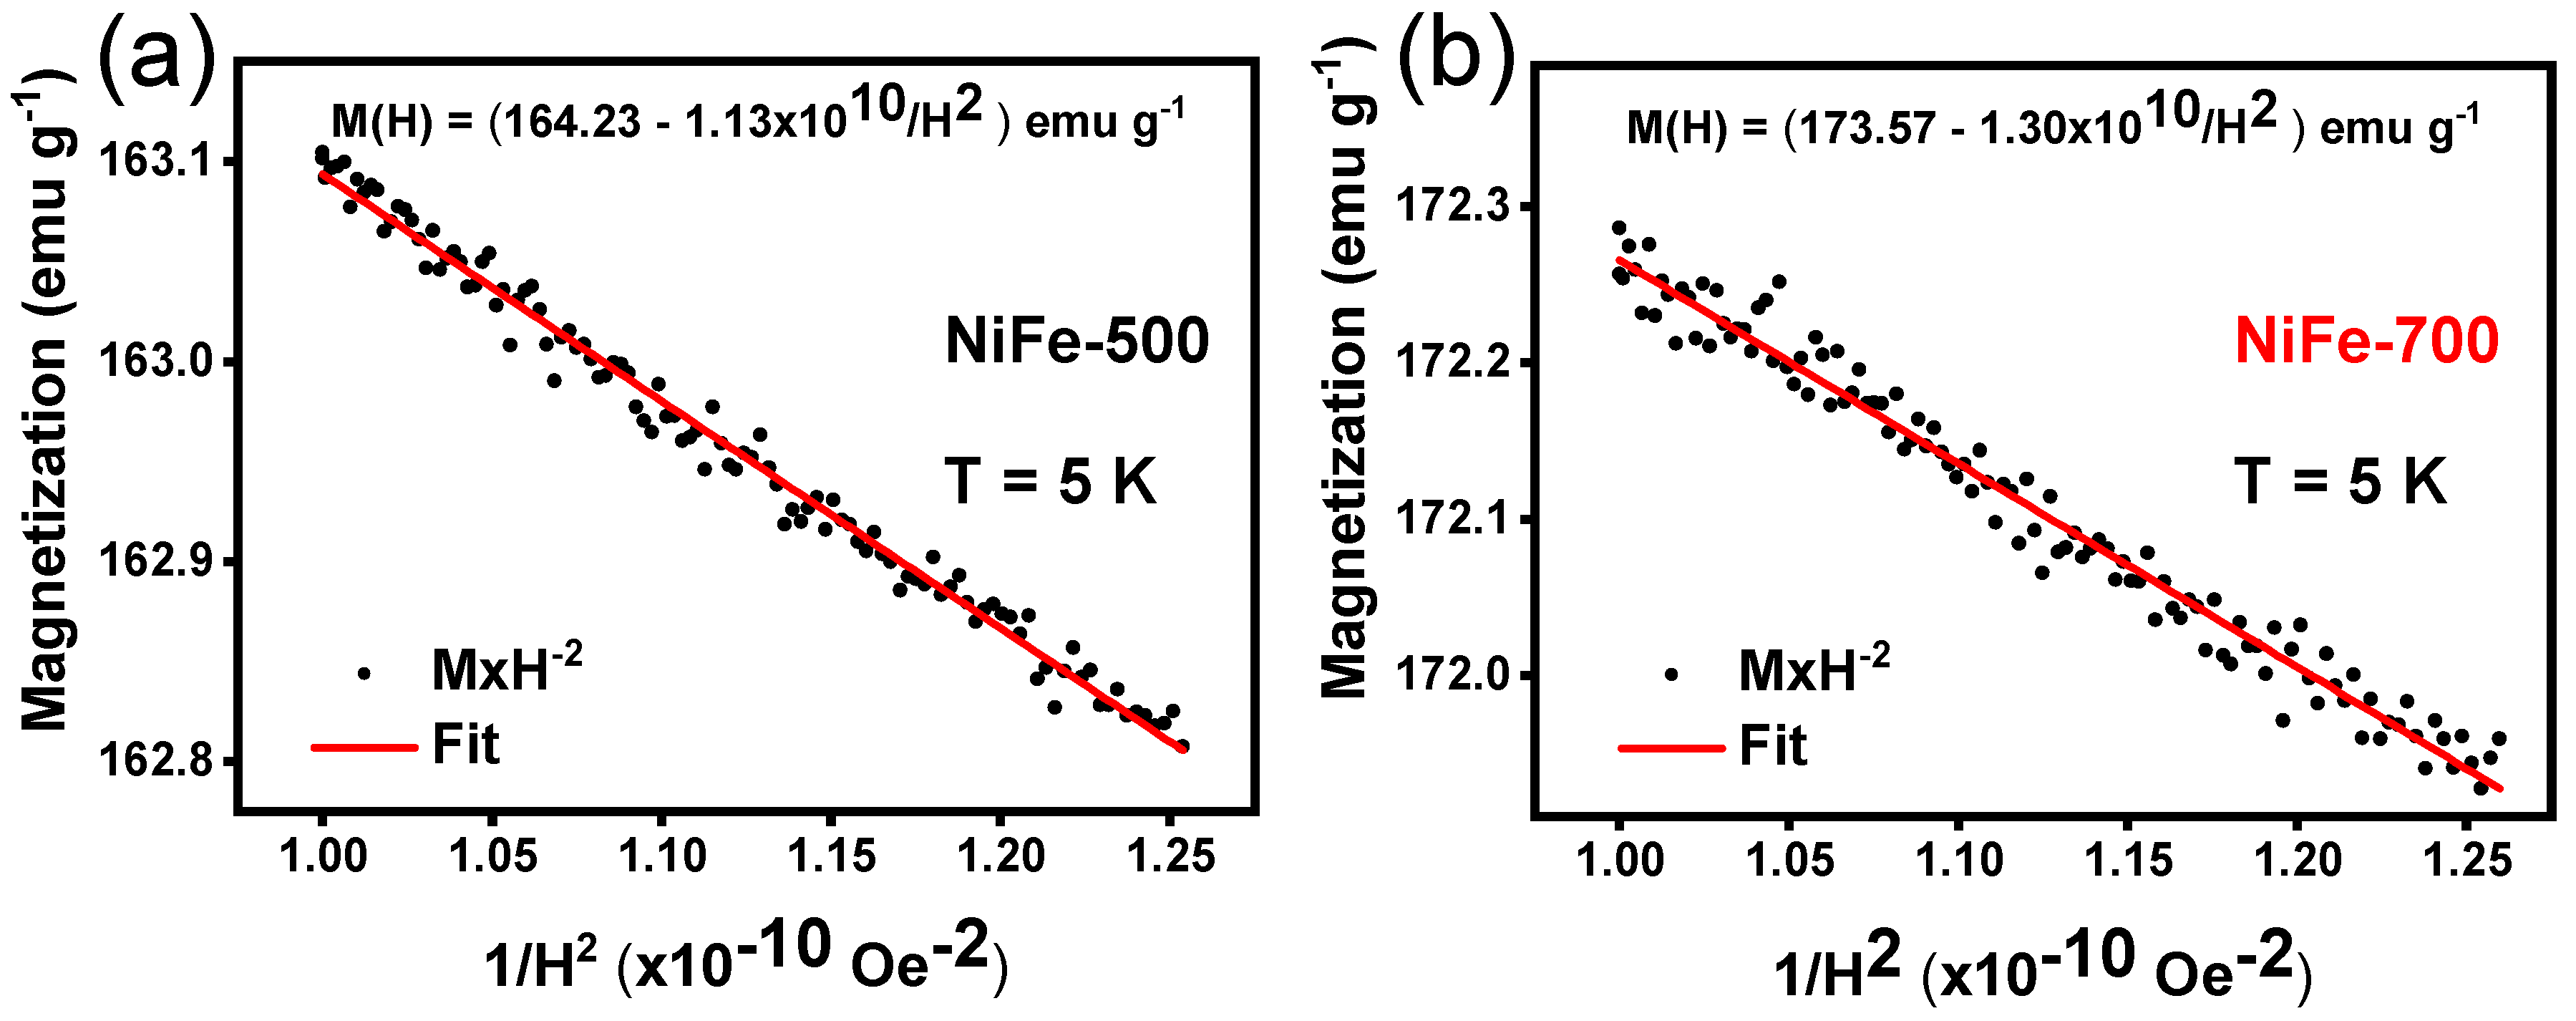
| NiFe-500 | 164.2 | 34.27 | 0.21 | 335.45 |
| NiFe-700 | 173.6 | 17.58 | 0.10 | 98.83 |
| Catalyst | Substrate | Synthesis Method | η10 (mV vs. RHE)/Electrolyte | Tafel Slope (mV dec−1) | Reference |
|---|---|---|---|---|---|
| NiFe-500 NPs NiFe-700 NPs | Ni foam | Sol–gel synthesis followed by a reduction in H2 | 319 307 | 72 57 | This work |
| NiFe-NiFe2O4 fibers | Ni foam | Solution blow spinning | 316 | 74 | [25] |
| NiFe foam | NiFe foam | - | 320 | 56 | [41] |
| NiFe thin films | Platinum mesh | Thermal evaporation | 370 | 37 | [42] |
| NiFe/graphene | PT foil | Hummers’ method followed by electrodeposition | 350 | 59 | [84] |
| NiFe/CC | carbon cloth | Chemical bath at room temperature followed by reduction | 281–340 | 64–71 | [81] |
| NiFe LDH | glassy carbon | Hydrothermal process | 347 | 67 | [85] |
| NiFeO | GC | Coprecipitation | 328 | 42 | [86] |
| NiFe/Au | Au-RDE | Electrodeposition | 330 | 58 | [87] |
| Ni0.9Fe0.1/NC | GC | Pyrolysis | 330 | 45 | [88] |
| NiFeOH/NF | NF | Impregnation | 342 | 55 | [89] |
| Ni-Fe-P Alloy | GC | Direct-current electrodeposition | 309 | 79.4 | [78] |
| Ni NP/NiFe LDH | - | Hydrothermal method | 328 | 62 | [90] |
| NiFe LDH | GC | Hydrothermal method | 328 | 59.9 | [91] |
| FeNi-FeNiO/CNS-700 | GC | Phosphating process | 355 | 80.1 | [92] |
| NiFe-LDH/NF | Ni foam | Electrodeposition | 370 | 131.2 | [93] |
| NiFe hydroxide | GC | Mild two-step hydrothermal reaction | 310 | 107 | [79] |
| Ni4/5Fe1/5-LDHs | GC | Hydrothermal method | 325 | 86.1 | [94] |
| Ni75Fe25 Ni50Fe50 Ni25Fe75 | Cu foil | Electrodeposition in DES | 316 321 361 | 62 58 44 | [40] |
| Electrode | RS (Ω) | RCT (Ω) | CPE (S.s−1) | n | CDL (mF) |
|---|---|---|---|---|---|
| NiFe-500 | 2.48 ± 0.004 | 1.22 ± 0.006 | 0.00339 ± 0.0001 | 0.8689 ± 0.0050 | 1.49 |
| NiFe-700 | 1.75 ± 0.003 | 1.16 ± 0.004 | 0.00407 ± 0.0001 | 0.8569 ± 0.0047 | 1.67 |
Disclaimer/Publisher’s Note: The statements, opinions and data contained in all publications are solely those of the individual author(s) and contributor(s) and not of MDPI and/or the editor(s). MDPI and/or the editor(s) disclaim responsibility for any injury to people or property resulting from any ideas, methods, instructions or products referred to in the content. |
© 2023 by the authors. Licensee MDPI, Basel, Switzerland. This article is an open access article distributed under the terms and conditions of the Creative Commons Attribution (CC BY) license (https://creativecommons.org/licenses/by/4.0/).
Share and Cite
Raimundo, R.A.; Silva, V.D.; Ferreira, L.S.; Loureiro, F.J.A.; Fagg, D.P.; Macedo, D.A.; Gomes, U.U.; Soares, M.M.; Gomes, R.M.; Morales, M.A. NiFe Alloy Nanoparticles Tuning the Structure, Magnetism, and Application for Oxygen Evolution Reaction Catalysis. Magnetochemistry 2023, 9, 201. https://doi.org/10.3390/magnetochemistry9080201
Raimundo RA, Silva VD, Ferreira LS, Loureiro FJA, Fagg DP, Macedo DA, Gomes UU, Soares MM, Gomes RM, Morales MA. NiFe Alloy Nanoparticles Tuning the Structure, Magnetism, and Application for Oxygen Evolution Reaction Catalysis. Magnetochemistry. 2023; 9(8):201. https://doi.org/10.3390/magnetochemistry9080201
Chicago/Turabian StyleRaimundo, Rafael A., Vinícius D. Silva, Luciena S. Ferreira, Francisco J. A. Loureiro, Duncan P. Fagg, Daniel A. Macedo, Uílame U. Gomes, Márcio M. Soares, Rodinei M. Gomes, and Marco A. Morales. 2023. "NiFe Alloy Nanoparticles Tuning the Structure, Magnetism, and Application for Oxygen Evolution Reaction Catalysis" Magnetochemistry 9, no. 8: 201. https://doi.org/10.3390/magnetochemistry9080201